Le rapport Zumper Seattle Metro a analysé les annonces immobilières actives en novembre dans 19 villes métropolitaines afin d'établir le classement des villes les plus et les moins chères, ainsi que celles où les loyers ont connu la plus forte augmentation. Le loyer médian d'un appartement d'une chambre dans l'État de Washington était de 1 193 $ le mois dernier.
Classement des villes par loyer
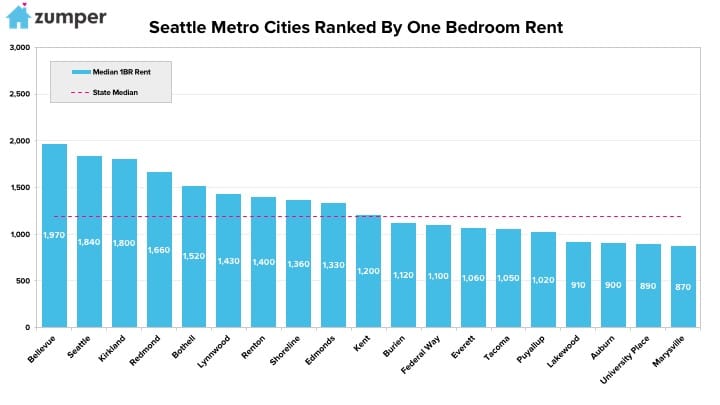
Le plus cher
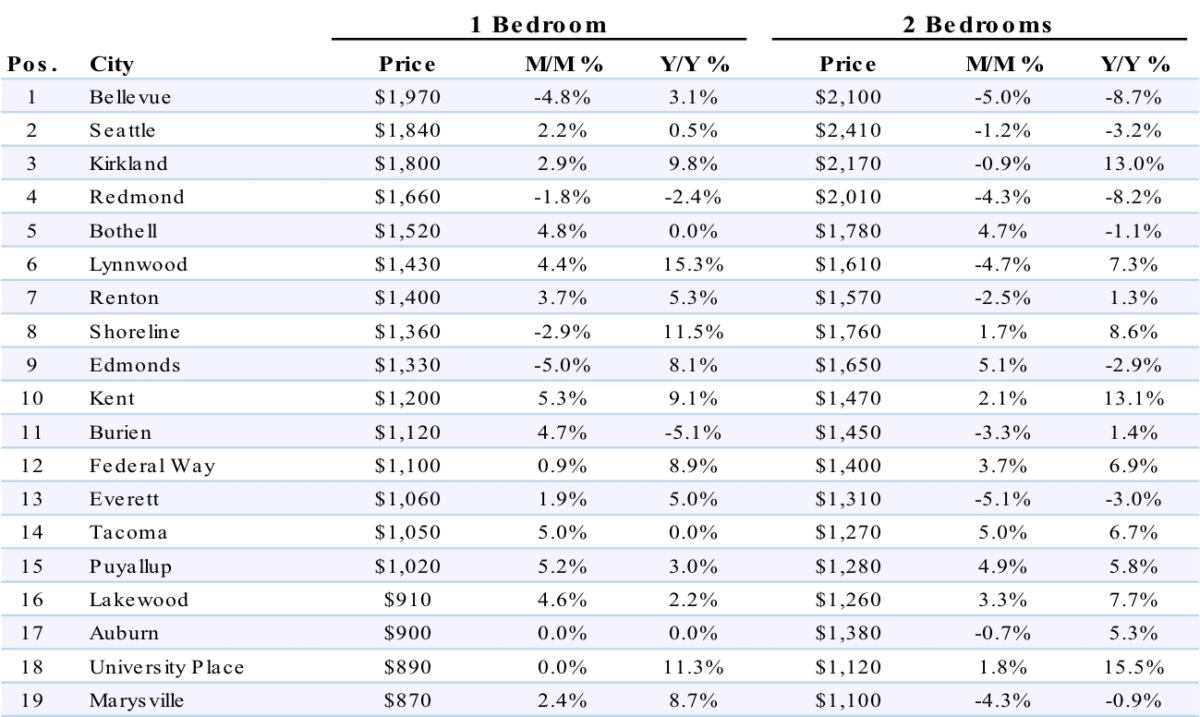
–Bellevue, Washington Bien que le loyer ait baissé de 4,81 TP3 TP à 1 TP4 TP1 970, il est resté le plus cher de la métropole.
–Seattle, WA classé deuxième avec des appartements d'une chambre au prix de $1 840.
–Kirkland, WA il était le troisième plus cher avec un loyer de $1 800.
Le moins cher
–Marysville, WA était la ville la plus abordable, avec un loyer de $870.
–University Place, WA suivi de près en tant que deuxième moins cher avec un loyer de $890.
–Auburn, Washington classé troisième avec une chambre à coucher à $900.
taux de croissance
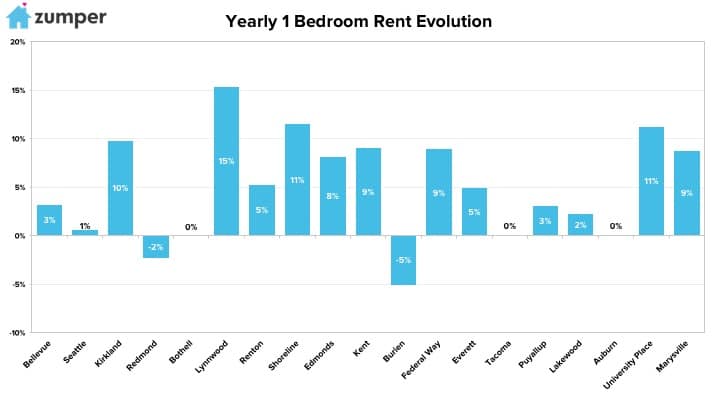
La croissance la plus rapide (Y/Y%)
–Lynwood, WA Les loyers ont enregistré le taux de croissance annuel le plus élevé, en hausse de 15,31 TP3T.
–Rivage, WA se classait deuxième avec un loyer en hausse de 11,5% depuis l'année dernière à la même époque.
-University Place, WA ont enregistré la troisième croissance la plus rapide des loyers, avec une hausse de 8,91 TP3T.
La croissance la plus rapide (M/M%)
–Kent, Washington Les prix ont connu leur plus forte croissance depuis le mois dernier, grimpant de 5,3%.
–Puyallup, État de Washington classé deuxième avec un taux de croissance mensuel de 5,2%.
–Tacoma, WA était troisième avec un loyer en hausse de 5%.
Données complètes
Capot Croissance % Loyer d'un appartement d'une chambre en décembre 2017
Highbridge 22.00% $1,525
Mott Haven 15.44% $1,720
Woodstock 14.62% $1,490
Morrisania 8.00% $1,350
East Flatbush 7.38% $1,600
Concourse Village 7.33% $1,610
Hunts Point 7.14% $1,350
Harlem central 5.75% $2,300
Brownsville 5.08% $1,550
Guillaume d'Édimbourg 4.81% $3,050
Plaines 4.31% $1,695
Gowanus 3.85% $2,700
Jardins Carroll 3.85% $2,700
Centre-ville de Brooklyn 3.81% $3,000
Fort Greene 3.57% $2,900
Midtown Est 3.45% $3,300
Melrose 2.86% $1,440
Foule 2.84% $1,450
Parc Gramercy 2.08% $3,675
Quartier de la confection 2.06% $3,470
DUMBO 2.00% $3,825
Maspeth 1.59% $1,600
Parc du coucher de soleil 1.41% $1,800
Colline de Boerum 1.40% $2,890
Flatbush 1.37% $1,850
Crochet rouge 1.24% $2,450
East Harlem 1.09% $2,325
Greenpoint 0.75% $2,700
Foxhurst 0.00% $1,350
Canarsie 0.00% $1,600
Longwood 0.00% $1,350
Prospect Heights 0.00% $2,650
Colline du Vinaigre 0.00% $3,700
Upper East Side 0.00% $2,700
Washington Heights -0.17% $1,797
East Village -0.17% $2,895
Bushwick -0.50% $2,199
Colline Murray -0.72% $3,400
Brooklyn Heights -0.87% $2,850
Village de Greenwich -1.30% $3,800
West Harlem -1.33% $2,220
Lower East Side -1.48% $2,660
Crown Heights -2.44% $2,000
Battery Park City -2.67% $3,650
Kensington -2.78% $1,750
Clinton Hill -2.91% $2,500
Inwood -2.94% $1,650
Port Morris -3.45% $1,400
Chelsea -3.52% $3,425
Ocean Hill -3.61% $1,600
Cobble Hill -3.64% $2,650
Upper West Side -4.00% $3,000
Soho -4.11% $3,500
West Village -4.61% $3,625
Long Island City -4.64% $2,670
Quartier financier -5.15% $3,500
Tribeca -5.75% $4,100
Astoria -5.88% $2,000
Bedford-Stuyvesant -8.30% $2,100
Park Slope -8.83% $2,425
Hell's Kitchen -9.09% $3,000
Borough Park -12.50% $1,750
Greenwood Heights -13.04% $2,000
Terrasse Windsor -13.73% $2,200
À propos
Le rapport Zumper Seattle Metro a analysé les annonces actives mises sur le marché en novembre 2017. Les annonces sont regroupées par ville pour calculer les loyers médians demandés.
Vous cherchez un nouveau logement ? Consultez toutes les annonces. Appartements à louer à Seattle Disponible dès maintenant sur Zumper.
Restez informé des actualités de Zumper en nous suivant sur Facebook, Gazouillement, Instagram, & Pinterest.
Contenu associé


