
Bedroom count
Property type
Last updated on July 1, 2026
Average rent in
South Weymouth, Weymouth Town, MA
Average rent in
Last updated on July 1, 2026
Bedroom count
Property type
Median rent
Median rent in South Weymouth
$2,495/mo
vs previous year
The average rent in South Weymouth is $2,495 per month as of June 2026. This is 28% above the national average rent, or $545 more per month.
average price per square foot
Total rentals
Available rentals in South Weymouth
17
for rent on Zumper.com as of June 2026
Rent price distribution
Share of South Weymouth rentals at each price point
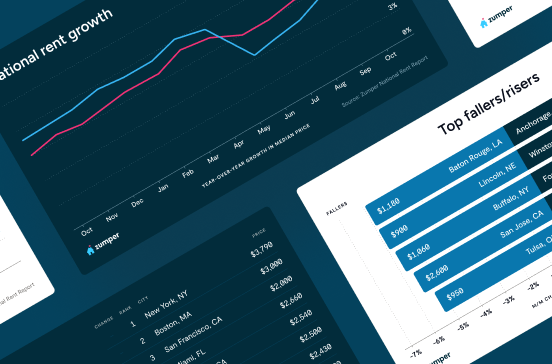
Rent trends in South Weymouth, Weymouth Town, MA
Average rent prices in South Weymouth have decreased by 3% over the last month and have increased by 2% since last year.
Rent trends
Rent prices on this page are calculated on a rolling 30-day basis and updated daily.
Compare rent prices in
South Weymouth, Weymouth Town, MA
Rent prices in South Weymouth vary by bedroom size, rental type, and neighborhood. The average rent for an apartment in South Weymouth is $2,398, whereas a house costs $3,500. 1-bedroom apartments in South Weymouth run $1,925 on average, while 2-bedroom apartments are $2,417.
Listings | ||||
|---|---|---|---|---|
Studio | $1,975 |  3% | 32% | |
1 bedroom | $2,183 | 1% |  4% | |
2 bedroom | $2,400 | 6% | 14% | |
3 bedroom | $3,136 | 14% | 56% | |
4 bedroom | $4,200 | 3% | - |
Listings | ||
|---|---|---|
Ashmont | $2,650 | |
Lower Washington Mount Hope | $3,000 | |
Quincy Center | $2,885 | |
Quincy Point | $2,425 | |
South Quincy | $2,660 | |
Stony Brook Cleary Square | $3,200 |
Listings | ||||
|---|---|---|---|---|
Apartments | $2,398 | 1% | No Change | |
Condos | $2,322 | 16% | No Change | |
Houses | $3,500 | 31% | No Change | |
Rooms | $1,410 | No Change | - |
Studio
Average rent
$1,975
Last 30 days
3%
Last year
32%
1 bedroom
Average rent
$2,183
Last 30 days
1%
Last year
4%
2 bedroom
Average rent
$2,400
Last 30 days
6%
Last year
14%
3 bedroom
Average rent
$3,136
Last 30 days
14%
Last year
56%
4 bedroom
Average rent
$4,200
Last 30 days
3%
Ashmont
Average rent
$2,650
Lower Washington Mount Hope
Average rent
$3,000
Stony Brook Cleary Square
Average rent
$3,200
Quincy Center
Average rent
$2,885
Quincy Point
Average rent
$2,425
South Quincy
Average rent
$2,660
Apartments
Average rent
$2,398
Last 30 days
1%
Condos
Average rent
$2,322
Last 30 days
16%
Houses
Average rent
$3,500
Last 30 days
31%
Rooms
Average rent
$1,410
The table above reflects average rent prices in South Weymouth, Weymouth Town, MA, broken down by the number of bedrooms, neighborhoods, and property types. The availability of data for each category is dependent on market inventory and will adjust depending on your selected filters.
How does rent in South Weymouth, Weymouth Town, MA compare to other neighborhoods?
Compare median rent prices in South Weymouth and Ashmont by all bedroom counts and property types.
South Weymouth
higher than the national median
higher than the national median
Takeaway
The median rent for all rentals in South Weymouth, Weymouth Town, MA is 6% lower than the median rent in Ashmont, Boston, MA.
Average rent in nearby neighborhoods
Explore rent trends in neighboring markets
Discover rentals in South Weymouth, Weymouth Town, MA

22h ago
80 Donald St, Weymouth Town, MA 02188
Studio–3 beds
1–2 baths
$1,679–$11,331
Price drop
The price shown reflects a 12-month lease. Fees may apply.Apartment for rent

5d+ ago
1002 Main St #5, Weymouth Town, MA 02190
2 beds
1 bath
$2,395
The price shown reflects a 12-month lease. Fees may apply.Condo for rent
Available Jul 1

5d+ ago
South Weymouth townhouse for rent in Weymouth Town
7 Chestnut Crk #1, Weymouth Town, MA 02190
2 beds
2.5 baths
$4,200
The price shown reflects a 12-month lease. Fees may apply.House for rent
Available Jan 1

2d ago
88 Pleasant St, Weymouth Town, MA 02190
1 bed
1 bath
$2,200
The price shown reflects a 12-month lease. Fees may apply.Apartment for rent

4d ago
1055 Main Street, Weymouth Town, MA 02190
1 bed
1 bath
$2,086
The price shown reflects a 12-month lease. Fees may apply.Apartment for rent
Available May 15
4d ago
1055 Main Street, Weymouth Town, MA 02190
1 bed
1 bath
$2,086
The price shown reflects a 12-month lease. Fees may apply.Apartment for rent
Available May 15
5d+ ago
South Weymouth townhouse for rent in Weymouth Town
7 Chestnut Crk #1, Weymouth Town, MA 02190
2 beds
2.5 baths
$4,200
The price shown reflects a 12-month lease. Fees may apply.House for rent
Available Jan 1
22h ago
80 Donald St, Weymouth Town, MA 02188
Studio–3 beds
1–2 baths
$1,679–$11,331
Price drop
The price shown reflects a 12-month lease. Fees may apply.Apartment for rent
4d ago
1055 Main Street, Weymouth Town, MA 02190
1 bed
1 bath
$2,086
The price shown reflects a 12-month lease. Fees may apply.Apartment for rent
Available May 15
2d ago
88 Pleasant St, Weymouth Town, MA 02190
1 bed
1 bath
$2,200
The price shown reflects a 12-month lease. Fees may apply.Apartment for rent
5d+ ago
1002 Main St #5, Weymouth Town, MA 02190
2 beds
1 bath
$2,395
The price shown reflects a 12-month lease. Fees may apply.Condo for rent
Available Jul 1


22h ago
80 Donald St, Weymouth Town, MA 02188
Studio–3 beds
1–2 baths
$1,679–$11,331
Price drop
The price shown reflects a 12-month lease. Fees may apply.Apartment for rent
5d+ ago
1002 Main St #5, Weymouth Town, MA 02190
2 beds
1 bath
$2,395
The price shown reflects a 12-month lease. Fees may apply.Condo for rent
Available Jul 1
Stay up to date with rental market insights

Are you interested in licensing our current and historical rental real estate data, or do you have custom data requests? Contact datalicensing@zumper.com.
Frequently asked questions for South Weymouth, Weymouth Town, MA
Quick answers to common questions about the South Weymouth rental market.
How much is rent in South Weymouth?
The average rent in South Weymouth is $2,495 per month as of June 27, 2026.
Is rent up or down in South Weymouth?
Average rent prices in South Weymouth have decreased by 3% over the last month and have increased by 2% since last year.
How does South Weymouth rent compare to the national average?
Rent in South Weymouth is 28% above the national average, which means renters are paying approximately $545 more per month.
What salary do I need to afford rent in South Weymouth?
To comfortably afford rent in South Weymouth, you'd need to earn approximately $100,000/year, based on spending no more than 30% of your income on rent.
Methodology
Rent prices are based on Zumper's rental listings from the past 30 days. Median rent is calculated across all available listings and property types on the platform. If you filter the page by bedroom count or property type, the pricing throughout the page will update automatically to reflect that segment of the rental market.
Household and population data come from the U.S. Census Bureau. Cost-of-living data is sourced from the Council for Community and Economic Research's Cost of Living Index (COLI).