
Bedroom count
Property type
Last updated on July 10, 2026
Average rent in
St. Peters, MO
Average rent in
Last updated on July 10, 2026
Bedroom count
Property type
Median rent
Median rent in St Peters
$2,060/mo
vs previous year
The average rent in St Peters is $2,060 per month as of July 2026. This is 6% above the national average rent, or $110 more per month.
average price per square foot
Total rentals
Available rentals in St Peters
17
for rent on Zumper.com as of July 2026
Rent price distribution
Share of St Peters rentals at each price point
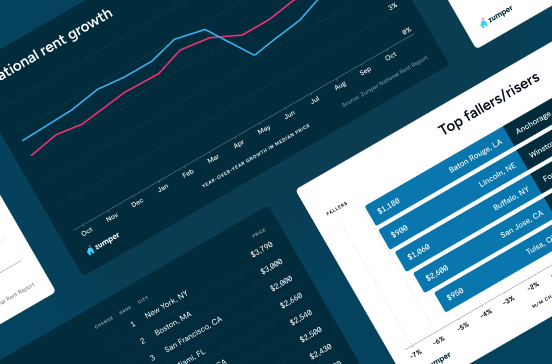
Rent trends in St. Peters, MO
Average rent prices in St Peters have decreased by 1% over the last month and have increased by 8% since last year.
Rent trends
Rent prices on this page are calculated on a rolling 30-day basis and updated daily.
Compare rent prices in
St. Peters, MO
Rent prices in St Peters vary by bedroom size, rental type, and neighborhood. The average rent for an apartment in St Peters is $1,717, whereas a house costs $2,300. 1-bedroom apartments in St Peters run $1,395 on average, while 2-bedroom apartments are $1,700.
Listings | ||||
|---|---|---|---|---|
1 bedroom | $1,425 |  19% | - | |
2 bedroom | $1,657 |  1% | 20% | |
3 bedroom | $2,100 | 2% | 9% | |
4 bedroom | $2,600 | 13% | - |
Listings | ||
|---|---|---|
Arrowhead Industrial Park | $2,015 | |
Cave Springs Estates | $1,755 | |
Hi Point Acres | $2,015 | |
Hickory Ridge | $2,100 | |
Ohmes Farm | $2,265 | |
Premier 370 Business Park | $1,799 | |
Savannah | $2,285 | |
Sunny Meadows Estates | $2,330 | |
Tanglewood | $1,800 | |
Turnberry | $1,925 |
Listings | ||||
|---|---|---|---|---|
Apartments | $1,717 | 26% | No Change | |
Condos | $1,585 | 1% | 6% | |
Houses | $2,300 | 7% | No Change | |
Rooms | $1,500 | - | - |
1 bedroom
Average rent
$1,425
Last 30 days
19%
2 bedroom
Average rent
$1,657
Last 30 days
1%
Last year
20%
3 bedroom
Average rent
$2,100
Last 30 days
2%
Last year
9%
4 bedroom
Average rent
$2,600
Last 30 days
13%
Hickory Ridge
Average rent
$2,100
Tanglewood
Average rent
$1,800
Turnberry
Average rent
$1,925
Sunny Meadows Estates
Average rent
$2,330
Arrowhead Industrial Park
Average rent
$2,015
Hi Point Acres
Average rent
$2,015
Savannah
Average rent
$2,285
Premier 370 Business Park
Average rent
$1,799
Cave Springs Estates
Average rent
$1,755
Ohmes Farm
Average rent
$2,265
Apartments
Average rent
$1,717
Last 30 days
26%
Condos
Average rent
$1,585
Last 30 days
1%
Last year
6%
Houses
Average rent
$2,300
Last 30 days
7%
Rooms
Average rent
$1,500
The table above reflects average rent prices in St. Peters, MO, broken down by the number of bedrooms, neighborhoods, and property types. The availability of data for each category is dependent on market inventory and will adjust depending on your selected filters.
How does rent in St Peters, MO compare to other cities?
Compare median rent prices in St Peters and Ballwin by all bedroom counts and property types.
St Peters
higher than the national median
higher than the national median
Takeaway
The median rent for all rentals in St Peters, MO is 14% lower than the median rent in Ballwin, MO.
Average rent in nearby cities
Explore rent trends in neighboring markets
$2,397
$1,350
$1,600
$2,020
$1,600
$1,695
$2,100
$2,100
$1,295
$1,762
$1,595
$2,100
Discover rentals in St. Peters, MO

5d+ ago
Hickory Ridge house for rent in St. Peters
3 beds
2 baths
$1,895
House for rent

5d+ ago
Verified
3 beds
2 baths
$2,365
House for rent
Available Jul 20
5d+ ago
Verified
3 beds
2 baths
$2,365
House for rent
Available Jul 20

1d ago
Verified
3 beds
1.5 baths
$2,315
$2,190
Price drop
House for rent
Available Aug 10
5d+ ago
Verified
3 beds
2 baths
$2,365
House for rent
Available Jul 20
5d+ ago
Hickory Ridge house for rent in St. Peters
3 beds
2 baths
$1,895
House for rent
1d ago
Verified
3 beds
1.5 baths
$2,315
$2,190
Price drop
House for rent
Available Aug 10
Stay up to date with rental market insights

Are you interested in licensing our current and historical rental real estate data, or do you have custom data requests? Contact datalicensing@zumper.com.
Frequently asked questions for St. Peters, MO
Quick answers to common questions about the St Peters rental market.
How much is rent in St Peters?
The average rent in St Peters is $2,060 per month as of July 4, 2026.
Is rent up or down in St Peters?
Average rent prices in St Peters have decreased by 1% over the last month and have increased by 8% since last year.
How does St Peters rent compare to the national average?
Rent in St Peters is 6% above the national average, which means renters are paying approximately $110 more per month.
Which neighborhoods are most affordable in St Peters?
The most affordable neighborhoods in St Peters are Cave Springs Estates ($1,755/mo), Premier 370 Business Park ($1,799/mo), and Tanglewood ($1,800/mo).
What salary do I need to afford rent in St Peters?
To comfortably afford rent in St Peters, you'd need to earn approximately $82,000/year, based on spending no more than 30% of your income on rent.
When is the best time of year to rent in St Peters?
St. Peters offers pet-friendly rental options for residents with furry companions. About 24% of listings welcome pets, providing a reasonable selection for renters who need to include their animals in their housing search.
Methodology
Rent prices are based on Zumper's rental listings from the past 30 days. Median rent is calculated across all available listings and property types on the platform. If you filter the page by bedroom count or property type, the pricing throughout the page will update automatically to reflect that segment of the rental market.
Household and population data come from the U.S. Census Bureau. Cost-of-living data is sourced from the Council for Community and Economic Research's Cost of Living Index (COLI).