
Bedroom count
Property type
Last updated on July 30, 2026
Average rent in
Ocean Isle Beach, NC
Average rent in
Last updated on July 30, 2026
Bedroom count
Property type
Median rent
Median rent in Ocean Isle Beach
$1,950/mo
vs previous year
The average rent in Ocean Isle Beach is $1,950 per month as of July 2026. This is 1% above the national average rent, or $20 more per month.
average price per square foot
Total rentals
Available rentals in Ocean Isle Beach
16
for rent on Zumper.com as of July 2026
Rent price distribution
Share of Ocean Isle Beach rentals at each price point
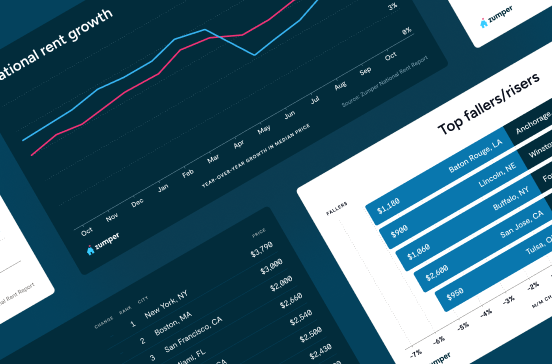
Rent trends in Ocean Isle Beach, NC
Average rent prices in Ocean Isle Beach have remained the same over the last month and have decreased by 15% since last year.
Rent trends
Rent prices on this page are calculated on a rolling 30-day basis and updated daily.
Compare rent prices in
Ocean Isle Beach, NC
Rent prices in Ocean Isle Beach vary by bedroom size, rental type, and neighborhood. The average rent for an apartment in Ocean Isle Beach is $1,747, whereas a house costs $2,000. 1-bedroom apartments in Ocean Isle Beach run $1,319 on average, while 2-bedroom apartments are $1,695.
Listings | ||||
|---|---|---|---|---|
Studio | $6,500 | - | - | |
1 bedroom | $1,365 |  2% |  21% | |
2 bedroom | $1,599 | 1% | 28% | |
3 bedroom | $1,850 | 2% | 12% | |
4 bedroom | $2,225 | 3% | 51% |
At this time, we don't have enough active inventory for all rentals to generate data. Please check back soon to see neighborhood rent prices in Ocean Isle Beach, NC.
Listings | ||||
|---|---|---|---|---|
Apartments | $1,747 | 3% | No Change | |
Condos | $1,625 | No Change | No Change | |
Houses | $2,000 | 1% | No Change |
Studio
Average rent
$6,500
1 bedroom
Average rent
$1,365
Last 30 days
2%
Last year
21%
2 bedroom
Average rent
$1,599
Last 30 days
1%
Last year
28%
3 bedroom
Average rent
$1,850
Last 30 days
2%
Last year
12%
4 bedroom
Average rent
$2,225
Last 30 days
3%
Last year
51%
At this time, we don't have enough active inventory for all rentals to generate data. Please check back soon to see neighborhood rent prices in Ocean Isle Beach, NC.
Apartments
Average rent
$1,747
Last 30 days
3%
Condos
Average rent
$1,625
Last 30 days
No Change
Houses
Average rent
$2,000
Last 30 days
1%
The table above reflects average rent prices in Ocean Isle Beach, NC, broken down by the number of bedrooms, neighborhoods, and property types. The availability of data for each category is dependent on market inventory and will adjust depending on your selected filters.
How does rent in Ocean Isle Beach, NC compare to other cities?
Compare median rent prices in Ocean Isle Beach and Burgaw by all bedroom counts and property types.
Ocean Isle Beach
higher than the national median
lower than the national median
Takeaway
The median rent for all rentals in Ocean Isle Beach, NC is 35% higher than the median rent in Burgaw, NC.
Average rent in nearby cities
Explore rent trends in neighboring markets
$1,440
$1,750
$2,095
$1,095
$2,200
$1,999
$2,159
$1,988
$1,500
$1,950
$1,650
$2,040
Discover rentals in Ocean Isle Beach, NC

5d+ ago
Townhouse for rent in Ocean Isle Beach
3 beds
2.5 baths
$1,850
House for rent

5d+ ago
Townhouse for rent in Ocean Isle Beach
3 beds
2.5 baths
$1,850
House for rent

5d+ ago
House for rent in Ocean Isle Beach
1584 Eyota Dr Sw, Ocean Isle Beach, NC 28469
3 beds
2 baths
$2,000
House for rent

5d+ ago
Townhouse for rent in Ocean Isle Beach
2106 Osprey Isle Ln Sw, Ocean Isle Beach, NC 28469
4 beds
3 baths
$2,200
House for rent
Available Jul 20


5d+ ago
House for rent in Ocean Isle Beach
1119 Cooper Hawk Ln Sw, Ocean Isle Beach, NC 28469
3 beds
2 baths
$2,300
House for rent
Available May 25

5d+ ago
Condo for rent in Ocean Isle Beach
2 beds
2 baths
$2,300
Condo for rent

5d+ ago
House for rent in Ocean Isle Beach
1593 W Kilbart Dr Sw, Ocean Isle Beach, NC 28469
2 beds
2 baths
$2,000
House for rent

5d+ ago
Apartment for rent in Ocean Isle Beach
112 Arnette Dr #A, Ocean Isle Beach, NC 28469
2 beds
2 baths
$1,950
Apartment for rent


5d+ ago
House for rent in Ocean Isle Beach
6393 Swainson St Sw, Ocean Isle Beach, NC 28469
4 beds
2 baths
$2,300
House for rent
Available Sep 14
5d+ ago
House for rent in Ocean Isle Beach
1114Cooper Hawk Ln Sw, Ocean Isle Beach, NC 28469
4 beds
3 baths
$2,400
House for rent
Available May 22
5d+ ago
House for rent in Ocean Isle Beach
1119 Cooper Hawk Ln Sw, Ocean Isle Beach, NC 28469
3 beds
2 baths
$2,300
House for rent
Available May 25
5d+ ago
House for rent in Ocean Isle Beach
6409 Swainson St Sw, Ocean Isle Beach, NC 28469
4 beds
2 baths
$2,250
House for rent
Available Oct 5
5d+ ago
House for rent in Ocean Isle Beach
6409 Swainson St Sw, Ocean Isle Beach, NC 28469
4 beds
2 baths
$2,250
House for rent
Available Oct 5
5d+ ago
Townhouse for rent in Ocean Isle Beach
2106 Osprey Isle Ln Sw, Ocean Isle Beach, NC 28469
4 beds
3 baths
$2,200
House for rent
Available Jul 20
5d+ ago
Townhouse for rent in Ocean Isle Beach
3 beds
2.5 baths
$1,850
House for rent
5d+ ago
Townhouse for rent in Ocean Isle Beach
3 beds
2.5 baths
$1,850
House for rent
5d+ ago
House for rent in Ocean Isle Beach
1864 W Long Acres Dr Sw #NA, Ocean Isle Beach, NC 28469
1 bed
1 bath
$1,695
$1,595
Price drop
House for rent
Available Jul 22
5d+ ago
House for rent in Ocean Isle Beach
6409 Swainson St Sw, Ocean Isle Beach, NC 28469
4 beds
2 baths
$2,250
House for rent
Available Oct 5
5d+ ago
Condo for rent in Ocean Isle Beach
2 beds
2 baths
$2,300
Condo for rent
Stay up to date with rental market insights

Are you interested in licensing our current and historical rental real estate data, or do you have custom data requests? Contact datalicensing@zumper.com.
Frequently asked questions for Ocean Isle Beach, NC
Quick answers to common questions about the Ocean Isle Beach rental market.
How much is rent in Ocean Isle Beach?
The average rent in Ocean Isle Beach is $1,950 per month as of July 25, 2026.
Is rent up or down in Ocean Isle Beach?
Average rent prices in Ocean Isle Beach have remained the same over the last month and have decreased by 15% since last year.
How does Ocean Isle Beach rent compare to the national average?
Rent in Ocean Isle Beach is 1% above the national average, which means renters are paying approximately $20 more per month.
What salary do I need to afford rent in Ocean Isle Beach?
To comfortably afford rent in Ocean Isle Beach, you'd need to earn approximately $78,000/year, based on spending no more than 30% of your income on rent.
Methodology
Rent prices are based on Zumper's rental listings from the past 30 days. Median rent is calculated across all available listings and property types on the platform. If you filter the page by bedroom count or property type, the pricing throughout the page will update automatically to reflect that segment of the rental market.
Household and population data come from the U.S. Census Bureau. Cost-of-living data is sourced from the Council for Community and Economic Research's Cost of Living Index (COLI).