
Bedroom count
Property type
Last updated on July 16, 2026
Average rent in
Monmouth Beach, NJ
Average rent in
Last updated on July 16, 2026
Bedroom count
Property type
Median rent
Median rent in Monmouth Beach
$8,200/mo
vs previous year
The average rent in Monmouth Beach is $8,200 per month as of July 2026. This is 321% above the national average rent, or $6,250 more per month.
average price per square foot
Total rentals
Available rentals in Monmouth Beach
29
for rent on Zumper.com as of July 2026
Rent price distribution
Share of Monmouth Beach rentals at each price point
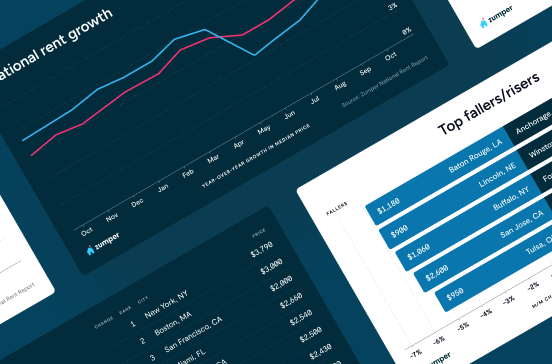
Rent trends in Monmouth Beach, NJ
Average rent prices in Monmouth Beach have decreased by 12% over the last month and have increased by 106% since last year.
Rent trends
Rent prices on this page are calculated on a rolling 30-day basis and updated daily.
Compare rent prices in
Monmouth Beach, NJ
Rent prices in Monmouth Beach vary by bedroom size, rental type, and neighborhood. The average rent for an apartment in Monmouth Beach is $3,300, whereas a house costs $10,400. 1-bedroom apartments in Monmouth Beach run $2,400 on average, while 2-bedroom apartments are $4,000.
Listings | ||||
|---|---|---|---|---|
Studio | $2,350 | - | - | |
1 bedroom | $2,750 |  8% | 59% | |
2 bedroom | $3,950 |  6% | 61% | |
3 bedroom | $10,000 | 16% | 69% | |
4 bedroom | $10,800 | 19% | 8% |
Listings | ||
|---|---|---|
Monmouth Beach | $8,200 |
Listings | ||||
|---|---|---|---|---|
Apartments | $3,300 | - | No Change | |
Condos | $4,500 | No Change | No Change | |
Houses | $10,400 | 17% | No Change |
Studio
Average rent
$2,350
1 bedroom
Average rent
$2,750
Last 30 days
8%
Last year
59%
2 bedroom
Average rent
$3,950
Last 30 days
6%
Last year
61%
3 bedroom
Average rent
$10,000
Last 30 days
16%
Last year
69%
4 bedroom
Average rent
$10,800
Last 30 days
19%
Last year
8%
Monmouth Beach
Average rent
$8,200
Apartments
Average rent
$3,300
Condos
Average rent
$4,500
Last 30 days
No Change
Houses
Average rent
$10,400
Last 30 days
17%
The table above reflects average rent prices in Monmouth Beach, NJ, broken down by the number of bedrooms, neighborhoods, and property types. The availability of data for each category is dependent on market inventory and will adjust depending on your selected filters.
How does rent in Monmouth Beach, NJ compare to other cities?
Compare median rent prices in Monmouth Beach and Bradley Beach by all bedroom counts and property types.
Monmouth Beach
higher than the national median
higher than the national median
Takeaway
The median rent for all rentals in Monmouth Beach, NJ is 141% higher than the median rent in Bradley Beach, NJ.
Average rent in nearby cities
Explore rent trends in neighboring markets
$3,400
$3,500
$2,225
$2,647
$4,850
$5,200
$3,700
$6,250
$13,000
$3,300
$2,825
$3,900
Discover rentals in Monmouth Beach, NJ

5d+ ago
Condo for rent in Monmouth Beach
54 Wharfside Dr #54, Monmouth Beach, NJ 07750
1 bed
1 bath
$2,200
Condo for rent

5d+ ago
Condo for rent in Monmouth Beach
169 Wharfside Dr #169, Monmouth Beach, NJ 07750
1 bed
1 bath
$2,200
Condo for rent

2d ago
Condo for rent in Monmouth Beach
34 Wharfside Dr, Monmouth Beach, NJ 07750
2 beds
1.5 baths
$2,295
Condo for rent

4d ago
Condo for rent in Monmouth Beach
34 Wharfside Dr #210, Monmouth Beach, NJ 07750
2 beds
1.5 baths
$2,295
Condo for rent


5d+ ago
House for rent in Monmouth Beach
7 Circle Dr, Monmouth Beach, NJ 07750
5 beds
5.5 baths
$50,000
House for rent

5d+ ago
House for rent in Monmouth Beach
17 Beach Rd, Monmouth Beach, NJ 07750
4 beds
3 baths
$30,000
House for rent

5d+ ago
House for rent in Monmouth Beach
7 Anderson St, Monmouth Beach, NJ 07750
4 beds
3.5 baths
$20,000
House for rent

5d+ ago
Condo for rent in Monmouth Beach
3 Wharfside Dr, Monmouth Beach, NJ 07750
1 bed
1 bath
$5,000
Condo for rent
5d+ ago
Condo for rent in Monmouth Beach
54 Wharfside Dr #54, Monmouth Beach, NJ 07750
1 bed
1 bath
$2,200
Condo for rent
5d+ ago
Condo for rent in Monmouth Beach
113 Wharfside Dr, Monmouth Beach, NJ 07750
2 beds
1.5 baths
$2,700
Condo for rent

5d+ ago
House for rent in Monmouth Beach
15 West St, Monmouth Beach, NJ 07750
3 beds
3.5 baths
$7,500
House for rent
4d ago
Condo for rent in Monmouth Beach
34 Wharfside Dr #210, Monmouth Beach, NJ 07750
2 beds
1.5 baths
$2,295
Condo for rent


2d ago
Condo for rent in Monmouth Beach
34 Wharfside Dr, Monmouth Beach, NJ 07750
2 beds
1.5 baths
$2,295
Condo for rent
4d ago
Condo for rent in Monmouth Beach
34 Wharfside Dr #210, Monmouth Beach, NJ 07750
2 beds
1.5 baths
$2,295
Condo for rent
5d+ ago
Condo for rent in Monmouth Beach
54 Wharfside Dr #54, Monmouth Beach, NJ 07750
1 bed
1 bath
$2,200
Condo for rent
5d+ ago
House for rent in Monmouth Beach
3 Monmouth Pl, Monmouth Beach, NJ 07750
4 beds
3 baths
$10,000
House for rent


Stay up to date with rental market insights

Are you interested in licensing our current and historical rental real estate data, or do you have custom data requests? Contact datalicensing@zumper.com.
Frequently asked questions for Monmouth Beach, NJ
Quick answers to common questions about the Monmouth Beach rental market.
How much is rent in Monmouth Beach?
The average rent in Monmouth Beach is $8,200 per month as of July 11, 2026.
Is rent up or down in Monmouth Beach?
Average rent prices in Monmouth Beach have decreased by 12% over the last month and have increased by 106% since last year.
How does Monmouth Beach rent compare to the national average?
Rent in Monmouth Beach is 321% above the national average, which means renters are paying approximately $6,250 more per month.
What salary do I need to afford rent in Monmouth Beach?
To comfortably afford rent in Monmouth Beach, you'd need to earn approximately $328,000/year, based on spending no more than 30% of your income on rent.
When is the best time of year to rent in Monmouth Beach?
Monmouth Beach's rental market has a limited selection of listings, averaging 29 available per month. The best time to look for an apartment would be when these listings are refreshed, typically at the start of a new month.
Methodology
Rent prices are based on Zumper's rental listings from the past 30 days. Median rent is calculated across all available listings and property types on the platform. If you filter the page by bedroom count or property type, the pricing throughout the page will update automatically to reflect that segment of the rental market.
Household and population data come from the U.S. Census Bureau. Cost-of-living data is sourced from the Council for Community and Economic Research's Cost of Living Index (COLI).