
Bedroom count
Property type
Last updated on July 31, 2026
Average rent in
Mason City, IA
Average rent in
Last updated on July 31, 2026
Bedroom count
Property type
Median rent
Median rent in Mason City
$750/mo
vs previous year
The average rent in Mason City is $750 per month as of July 2026. This is 61% below the national average rent, or $1,180 less per month.
average price per square foot
Total rentals
Available rentals in Mason City
21
for rent on Zumper.com as of July 2026
Rent price distribution
Share of Mason City rentals at each price point
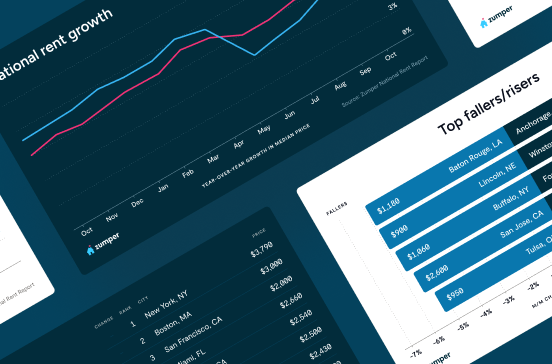
Rent trends in Mason City, IA
Average rent prices in Mason City have increased by 2% over the last month and have decreased by 42% since last year.
Rent trends
Rent prices on this page are calculated on a rolling 30-day basis and updated daily.
Compare rent prices in
Mason City, IA
Rent prices in Mason City vary by bedroom size, rental type, and neighborhood. The average rent for an apartment in Mason City is $750, whereas a house costs $1,350. 1-bedroom apartments in Mason City run $625 on average, while 2-bedroom apartments are $795.
Listings | ||||
|---|---|---|---|---|
Studio | $975 |  39% | 54% | |
1 bedroom | $660 | No Change |  42% | |
2 bedroom | $795 | 5% | 36% | |
3 bedroom | $2,700 | 4% | 45% |
At this time, we don't have enough active inventory for all rentals to generate data. Please check back soon to see neighborhood rent prices in Mason City, IA.
Listings | ||||
|---|---|---|---|---|
Apartments | $750 | 4% | No Change | |
Houses | $1,350 | 33% | No Change |
Studio
Average rent
$975
Last 30 days
39%
Last year
54%
1 bedroom
Average rent
$660
Last 30 days
No Change
Last year
42%
2 bedroom
Average rent
$795
Last 30 days
5%
Last year
36%
3 bedroom
Average rent
$2,700
Last 30 days
4%
Last year
45%
At this time, we don't have enough active inventory for all rentals to generate data. Please check back soon to see neighborhood rent prices in Mason City, IA.
Apartments
Average rent
$750
Last 30 days
4%
Houses
Average rent
$1,350
Last 30 days
33%
The table above reflects average rent prices in Mason City, IA, broken down by the number of bedrooms, neighborhoods, and property types. The availability of data for each category is dependent on market inventory and will adjust depending on your selected filters.
How does rent in Mason City, IA compare to other cities?
Compare median rent prices in Mason City and Ames by all bedroom counts and property types.
Mason City
lower than the national median
lower than the national median
Takeaway
The median rent for all rentals in Mason City, IA is 21% lower than the median rent in Ames, IA.
Average rent in nearby cities
Explore rent trends in neighboring markets
Cost of living in Mason City, IA
Explore the cost of essential expenses, and then use our rent calculator to find out how much rent you can afford.
Expenses accrued by most renters | Average cost compared to national average |
|---|---|
| Goods & Services | 1% lower |
| Groceries | 3% lower |
| Health | 3% lower |
| Housing | 24% lower |
| Transportation | No difference |
| Utilities | 4% lower |
Discover rentals in Mason City, IA

3d ago
333 W State St, Mason City, IA 50401
1 bed
1 bath
$550
Apartment for rent

3d ago
216 3rd St Ne, Mason City, IA 50401
1 bed
1 bath
$550
Apartment for rent

5d+ ago
Apartment for rent in Mason City
220 3rd St Ne #1, Mason City, IA 50401
1 bed
1 bath
$550
Apartment for rent
Available Jul 28

2d ago
Apartment for rent in Mason City
N Connecticut Ave #2, Mason City, IA 50401
2 beds
1 bath
$725
Apartment for rent
Available Jul 28


5d+ ago
House for rent in Mason City
9 2nd St Nw, Mason City, IA 50401
Studio
0 baths
$2,950
House for rent

5d+ ago
House for rent in Mason City
124 N Federal Ave, Mason City, IA 50401
Studio
0 baths
$1,950
House for rent

4d ago
100 4th St Sw, Mason City, IA 50401
Studio–2 beds
1–2 baths
$895–$1,265
Apartment for rent

5d+ ago
House for rent in Mason City
202 1st St Se #151, Mason City, IA 50401
Studio
0 baths
$1,000
House for rent

11h ago
651 6th St Se, Mason City, IA 50401
1–2 beds
1 bath
$750–$850
Apartment for rent

1d ago
510 S Illinois Ave, Mason City, IA 50401
1 bed
1 bath
$695
Apartment for rent
2d ago
Apartment for rent in Mason City
N Connecticut Ave #2, Mason City, IA 50401
2 beds
1 bath
$725
Apartment for rent
Available Jul 28
3d ago
407 S Tennessee Ave, Mason City, IA 50401
2 beds
1 bath
$750
Apartment for rent

1d ago
510 S Illinois Ave, Mason City, IA 50401
1 bed
1 bath
$695
Apartment for rent
3d ago
407 S Tennessee Ave, Mason City, IA 50401
2 beds
1 bath
$750
Apartment for rent
3d ago
407 5th St Nw, Mason City, IA 50401
2 beds
1 bath
$750
Apartment for rent
4d ago
100 4th St Sw, Mason City, IA 50401
Studio–2 beds
1–2 baths
$895–$1,265
Apartment for rent

1d ago
510 S Illinois Ave, Mason City, IA 50401
1 bed
1 bath
$695
Apartment for rent
2d ago
Apartment for rent in Mason City
N Connecticut Ave #2, Mason City, IA 50401
2 beds
1 bath
$725
Apartment for rent
Available Jul 28
3d ago
407 S Tennessee Ave, Mason City, IA 50401
2 beds
1 bath
$750
Apartment for rent
3d ago
333 W State St, Mason City, IA 50401
1 bed
1 bath
$550
Apartment for rent

Stay up to date with rental market insights

Are you interested in licensing our current and historical rental real estate data, or do you have custom data requests? Contact datalicensing@zumper.com.
Frequently asked questions for Mason City, IA
Quick answers to common questions about the Mason City rental market.
How much is rent in Mason City?
The average rent in Mason City is $750 per month as of July 25, 2026.
Is rent up or down in Mason City?
Average rent prices in Mason City have increased by 2% over the last month and have decreased by 42% since last year.
How does Mason City rent compare to the national average?
Rent in Mason City is 61% below the national average, which means renters are paying approximately $1,180 less per month.
What salary do I need to afford rent in Mason City?
To comfortably afford rent in Mason City, you'd need to earn approximately $30,000/year, based on spending no more than 30% of your income on rent.
When is the best time of year to rent in Mason City?
Based on our current listings, 43% of Mason City rentals welcome pets, which works out to about 10 pet-friendly apartments each month across the city's average inventory of 23 units.
Methodology
Rent prices are based on Zumper's rental listings from the past 30 days. Median rent is calculated across all available listings and property types on the platform. If you filter the page by bedroom count or property type, the pricing throughout the page will update automatically to reflect that segment of the rental market.
Household and population data come from the U.S. Census Bureau. Cost-of-living data is sourced from the Council for Community and Economic Research's Cost of Living Index (COLI).