
Bedroom count
Property type
Last updated on July 30, 2026
Average rent in
Davenport, IA
Average rent in
Last updated on July 30, 2026
Bedroom count
Property type
Key takeaways for renters
The bottom line
Davenport, IA rent rose 3.1% year over year, with a current median of $950/month. Renters today are paying $43 more per month on average than last year despite a 5.3% month-over-month decline in July 2026.
Compared to national trends
Davenport is 50.8% more affordable than the $1,930/month national median, offering a lower-cost market with 118 total rentals available.
Price ranges
Apartments make up 74.2% of rentals and rent for a median of $895/month, while houses run higher at $1,495/month. By bedroom, studios rent for $795/month, 1-bedrooms $755/month, and 2-bedrooms $995/month, with 4+ bedrooms reaching $2,025/month.
Neighborhood spotlight
Riverview Terrace rents climbed 45.8% year over year to $999/month, contrasting with Hilltop where rents fell 29.6% to $950/month. This divergence reflects localized shifts within Davenport's broader market trends.
Median rent
Median rent in Davenport
$950/mo
vs previous year
The average rent in Davenport is $950 per month as of July 2026. This is 51% below the national average rent, or $980 less per month.
average price per square foot
Total rentals
Available rentals in Davenport
118
for rent on Zumper.com as of July 2026
Rent price distribution
Share of Davenport rentals at each price point
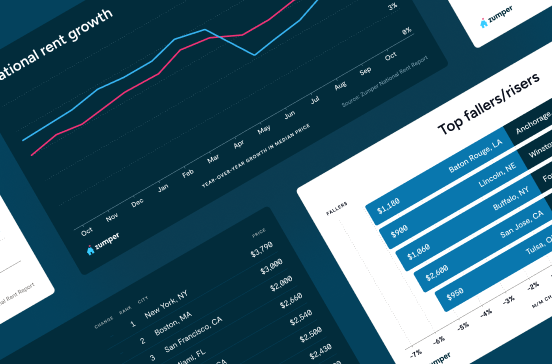
Rent trends in Davenport, IA
Average rent prices in Davenport have decreased by 5% over the last month and have increased by 3% since last year.
Rent trends
Rent prices on this page are calculated on a rolling 30-day basis and updated daily.
Compare rent prices in
Davenport, IA
Rent prices in Davenport vary by bedroom size, rental type, and neighborhood. The average rent for an apartment in Davenport is $895, whereas a house costs $1,495. 1-bedroom apartments in Davenport run $750 on average, while 2-bedroom apartments are $950.
Listings | ||||
|---|---|---|---|---|
Studio | $795 |  2% |  26% | |
1 bedroom | $755 | 3% | 1% | |
2 bedroom | $995 | 1% | 2% | |
3 bedroom | $1,377 | 1% | 11% | |
4 bedroom | $2,025 | 6% | 39% |
Listings | ||
|---|---|---|
Centennial Gateway | $795 | |
Downtown Davenport | $1,250 | |
Fejervary | $850 | |
Gold Coast | $975 | |
Hilltop | $950 | |
Jefferson | $1,000 | |
North Side | $895 | |
Northwest Davenport | $837 | |
Riverview Terrace | $999 | |
Southwest Gateway | $852 |
Listings | ||||
|---|---|---|---|---|
Apartments | $895 | 3% | No Change | |
Condos | $1,380 | 41% | No Change | |
Houses | $1,495 | 4% | No Change |
Studio
Average rent
$795
Last 30 days
2%
Last year
26%
1 bedroom
Average rent
$755
Last 30 days
3%
Last year
1%
2 bedroom
Average rent
$995
Last 30 days
1%
Last year
2%
3 bedroom
Average rent
$1,377
Last 30 days
1%
Last year
11%
4 bedroom
Average rent
$2,025
Last 30 days
6%
Last year
39%
North Side
Average rent
$895
Downtown Davenport
Average rent
$1,250
Northwest Davenport
Average rent
$837
Centennial Gateway
Average rent
$795
Jefferson
Average rent
$1,000
Gold Coast
Average rent
$975
Riverview Terrace
Average rent
$999
Southwest Gateway
Average rent
$852
Fejervary
Average rent
$850
Hilltop
Average rent
$950
Apartments
Average rent
$895
Last 30 days
3%
Condos
Average rent
$1,380
Last 30 days
41%
Houses
Average rent
$1,495
Last 30 days
4%
The table above reflects average rent prices in Davenport, IA, broken down by the number of bedrooms, neighborhoods, and property types. The availability of data for each category is dependent on market inventory and will adjust depending on your selected filters.
How does rent in Davenport, IA compare to other cities?
Compare median rent prices in Davenport and Bettendorf by all bedroom counts and property types.
Davenport
lower than the national median
lower than the national median
Takeaway
The median rent for all rentals in Davenport, IA is 21% lower than the median rent in Bettendorf, IA.
Average rent in nearby cities
Explore rent trends in neighboring markets
$1,200
$1,035
$1,175
$1,047
$872
$1,169
$825
$1,010
$1,000
$1,099
$897
$1,175
Cost of living in Davenport, IA
Explore the cost of essential expenses, and then use our rent calculator to find out how much rent you can afford.
Expenses accrued by most renters | Average cost compared to national average |
|---|---|
| Goods & Services | 3% lower |
| Groceries | 3% lower |
| Health | 6% lower |
| Housing | 19% lower |
| Transportation | 5% higher |
| Utilities | 20% lower |
Discover rentals in Davenport, IA

18h ago
1140 E 37th St, Davenport, IA 52807
1–3 beds
1–2 baths
$564–$1,306
Apartment for rent

4d ago
1505 E 39th St, Davenport, IA 52807
2 beds
1 bath
$734
Apartment for rent

1d ago
710 W 63rd St, Davenport, IA 52806
2 beds
1 bath
$750
Apartment for rent

2d ago
644 W 63rd St, Davenport, IA 52806
2 beds
1 bath
$775
Apartment for rent


5d+ ago
North Side house for rent in Davenport
4 beds
2.5 baths
$2,775
House for rent

5d+ ago
North Side house for rent in Davenport
3 beds
2 baths
$2,750
House for rent
Available Sep 1

11h ago
Lakeview Pkwy - Ravenwood Ln, Davenport, IA 52807
3 beds
2 baths
$2,470–$2,595
Apartment for rent

5d+ ago
North Side house for rent in Davenport
1425 W 54th St #NA, Davenport, IA 52806
3 beds
1.5 baths
$2,100
House for rent
Available Aug 1


2d ago
305-418 305-418 Betsy Ross Pl / 305-417 Paul Revere Pl / 306-322 W. 65th St / 601 W. 61st St / 6505-6604 N. Harrison St / 6543 Scott St, Davenport, IA 52806
1–2 beds
1 bath
$720–$775
Apartment for rent
5d+ ago
North Side house for rent in Davenport
4 beds
2.5 baths
$2,775
House for rent

5d+ ago
1650 West 42nd Street, Davenport, IA 52806
2 beds
1 bath
$1,199
Apartment for rent
Available Feb 20

5d+ ago
2416 East 50th Street, Davenport, IA 52807
2 beds
1 bath
$1,099
Apartment for rent
Available Mar 1


5d+ ago
Verified
3303 W 18th St #NA, Davenport, IA 52804
2 beds
1 bath
$1,100
House for rent
Available Aug 1
2h ago
427 427 & 505 Iowa Street, Davenport, IA 52801
1–2 beds
1 bath
$852–$1,352
Apartment for rent

1d ago
2700 E 53rd St, Davenport, IA 52807
1 bed
1 bath
$541–$785
Apartment for rent
2d ago
230 W 3rd St, Davenport, IA 52801
Studio
1 bath
$815
Apartment for rent


3d ago
305-418 305-418 Betsy Ross Pl / 305-417 Paul Revere Pl / 306-322 W. 65th St / 601 W. 61st St / 6505-6604 N. Harrison St / 6543 Scott St, Davenport, IA 52806
2 beds
1 bath
$775
Apartment for rent
1h ago
4323 N Division St, Davenport, IA 52806
3 beds
1 bath
$1,299
Apartment for rent
2h ago
427 427 & 505 Iowa Street, Davenport, IA 52801
1 bed
1 bath
$852
Apartment for rent
3h ago
620 W 63rd St, Davenport, IA 52806
1–2 beds
1 bath
$700–$800
Apartment for rent

Stay up to date with rental market insights

Are you interested in licensing our current and historical rental real estate data, or do you have custom data requests? Contact datalicensing@zumper.com.
Frequently asked questions for Davenport, IA
Quick answers to common questions about the Davenport rental market.
How much is rent in Davenport?
The average rent in Davenport is $950 per month as of July 25, 2026.
Is rent up or down in Davenport?
Average rent prices in Davenport have decreased by 5% over the last month and have increased by 3% since last year.
How does Davenport rent compare to the national average?
Rent in Davenport is 51% below the national average, which means renters are paying approximately $980 less per month.
Which neighborhoods are most affordable in Davenport?
The most affordable neighborhoods in Davenport are Centennial Gateway ($795/mo), Northwest Davenport ($837/mo), and Fejervary ($850/mo).
What salary do I need to afford rent in Davenport?
To comfortably afford rent in Davenport, you'd need to earn approximately $38,000/year, based on spending no more than 30% of your income on rent.
When is the best time of year to rent in Davenport?
Based on Zumper's July 2026 data, one-bedroom apartments in Davenport average around $770/month and two-bedrooms approximately $960/month.
Methodology
Rent prices are based on Zumper's rental listings from the past 30 days. Median rent is calculated across all available listings and property types on the platform. If you filter the page by bedroom count or property type, the pricing throughout the page will update automatically to reflect that segment of the rental market.
Household and population data come from the U.S. Census Bureau. Cost-of-living data is sourced from the Council for Community and Economic Research's Cost of Living Index (COLI).