
Bedroom count
Property type
Last updated on July 13, 2026
Average rent in
Bridgehampton, NY
Average rent in
Last updated on July 13, 2026
Bedroom count
Property type
Median rent
Median rent in Bridgehampton
$55,000/mo
vs previous year
The average rent in Bridgehampton is $55,000 per month as of July 2026. This is 2721% above the national average rent, or $53,050 more per month.
average price per square foot
Total rentals
Available rentals in Bridgehampton
34
for rent on Zumper.com as of July 2026
Rent price distribution
Share of Bridgehampton rentals at each price point
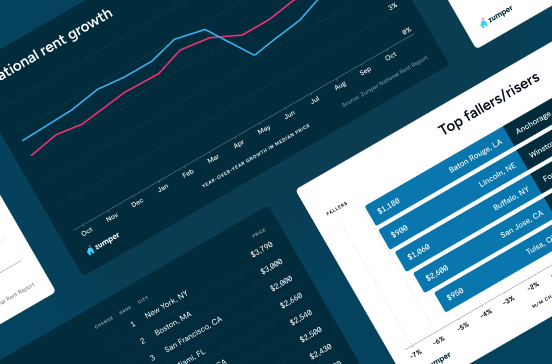
Rent trends in Bridgehampton, NY
Average rent prices in Bridgehampton have increased by 22% over the last month and have increased by 10% since last year.
Rent trends
Rent prices on this page are calculated on a rolling 30-day basis and updated daily.
Compare rent prices in
Bridgehampton, NY
Rent prices in Bridgehampton vary by bedroom size, rental type, and neighborhood. The average rent for an apartment in Bridgehampton is $50,000, whereas a house costs $55,000.
Listings | ||||
|---|---|---|---|---|
2 bedroom | $25,000 | - | - | |
3 bedroom | $45,000 |  21% | 36% | |
4 bedroom | $64,285 | 42% | 44% |
At this time, we don't have enough active inventory for all rentals to generate data. Please check back soon to see neighborhood rent prices in Bridgehampton, NY.
Listings | ||||
|---|---|---|---|---|
Apartments | $50,000 | 550% | - | |
Condos | $30,000 | - | No Change | |
Houses | $55,000 | 35% | No Change |
2 bedroom
Average rent
$25,000
3 bedroom
Average rent
$45,000
Last 30 days
21%
Last year
36%
4 bedroom
Average rent
$64,285
Last 30 days
42%
Last year
44%
At this time, we don't have enough active inventory for all rentals to generate data. Please check back soon to see neighborhood rent prices in Bridgehampton, NY.
Apartments
Average rent
$50,000
Last 30 days
550%
Condos
Average rent
$30,000
Houses
Average rent
$55,000
Last 30 days
35%
The table above reflects average rent prices in Bridgehampton, NY, broken down by the number of bedrooms, neighborhoods, and property types. The availability of data for each category is dependent on market inventory and will adjust depending on your selected filters.
How does rent in Bridgehampton, NY compare to other cities?
Compare median rent prices in Bridgehampton and Amagansett by all bedroom counts and property types.
Bridgehampton
higher than the national median
higher than the national median
Takeaway
The median rent for all rentals in Bridgehampton, NY is 57% higher than the median rent in Amagansett, NY.
Average rent in nearby cities
Explore rent trends in neighboring markets
$35,000
$25,000
$44,000
$35,000
$5,000
$25,000
$14,076
$36,818
$30,000
$21,500
$12,753
$64,999
Discover rentals in Bridgehampton, NY

5d+ ago
House for rent in Bridgehampton
126 Narrow Ln, Bridgehampton, NY 11932
3 beds
2 baths
$20,000
House for rent

5d+ ago
Townhouse for rent in Bridgehampton
4 beds
2.5 baths
$22,000
House for rent

5d+ ago
House for rent in Bridgehampton
4 Arthur Ave, Bridgehampton, NY 11932
4 beds
3 baths
$22,297
House for rent

5d+ ago
House for rent in Bridgehampton
73 Sea Farm Ln, Bridgehampton, NY 11932
4 beds
4 baths
$30,000
House for rent


5d+ ago
House for rent in Bridgehampton
98 Mitchells Ln, Bridgehampton, NY 11932
4 beds
5 baths
$100,000
House for rent

5d+ ago
House for rent in Bridgehampton
34 Birchwood Ln, Bridgehampton, NY 11932
4 beds
4.5 baths
$100,000
House for rent

5d+ ago
House for rent in Bridgehampton
65 Audubon Ave, Bridgehampton, NY 11932
4 beds
4.5 baths
$99,264
House for rent

5d+ ago
House for rent in Bridgehampton
2749 Montauk Hwy, Bridgehampton, NY 11932
4 beds
3.5 baths
$95,000
House for rent


5d+ ago
Townhouse for rent in Bridgehampton
4 beds
3 baths
$45,000
House for rent

5d+ ago
Apartment for rent in Bridgehampton
10 Aelfies Way, Bridgehampton, NY 11932
3 beds
2.5 baths
$45,000
Apartment for rent

5d+ ago
House for rent in Bridgehampton
47 Tansey Ln, Bridgehampton, NY 11932
5 beds
4.5 baths
$64,285
House for rent

4d ago
House for rent in Bridgehampton
350 Highland Ter, Bridgehampton, NY 11932
4 beds
3.5 baths
$55,000
House for rent

5d+ ago
House for rent in Bridgehampton
21 Birchwood Ln, Bridgehampton, NY 11932
4 beds
3.5 baths
$55,000
House for rent


4d ago
House for rent in Bridgehampton
350 Highland Ter, Bridgehampton, NY 11932
4 beds
3.5 baths
$55,000
House for rent

5d+ ago
Townhouse for rent in Bridgehampton
5 beds
4.5 baths
$100,000
$95,000
Price drop
House for rent
5d+ ago
House for rent in Bridgehampton
21 Birchwood Ln, Bridgehampton, NY 11932
4 beds
3.5 baths
$55,000
House for rent
5d+ ago
House for rent in Bridgehampton
59 Hildreth Ln, Bridgehampton, NY 11932
3 beds
3 baths
$38,000
House for rent

Stay up to date with rental market insights

Are you interested in licensing our current and historical rental real estate data, or do you have custom data requests? Contact datalicensing@zumper.com.
Frequently asked questions for Bridgehampton, NY
Quick answers to common questions about the Bridgehampton rental market.
How much is rent in Bridgehampton?
The average rent in Bridgehampton is $55,000 per month as of July 11, 2026.
Is rent up or down in Bridgehampton?
Average rent prices in Bridgehampton have increased by 22% over the last month and have increased by 10% since last year.
How does Bridgehampton rent compare to the national average?
Rent in Bridgehampton is 2721% above the national average, which means renters are paying approximately $53,050 more per month.
What salary do I need to afford rent in Bridgehampton?
To comfortably afford rent in Bridgehampton, you'd need to earn approximately $2,200,000/year, based on spending no more than 30% of your income on rent.
Methodology
Rent prices are based on Zumper's rental listings from the past 30 days. Median rent is calculated across all available listings and property types on the platform. If you filter the page by bedroom count or property type, the pricing throughout the page will update automatically to reflect that segment of the rental market.
Household and population data come from the U.S. Census Bureau. Cost-of-living data is sourced from the Council for Community and Economic Research's Cost of Living Index (COLI).