Renters have more negotiating power in 2026 than they did three years ago in almost every major market. In fact, much of the country is now a renter’s market. However, how much leverage you have still depends on where you sign a lease.
To measure it, we built the Zumper Renter Leverage Index. It grades each city from A to F on six signals of how hard property owners have competed for renters. Four come from Zumper listing data: rent changes, month-free offers, price drops, and how long new units sit unrented. The other two, rental vacancy and new housing supply, come from the U.S. Census Bureau. An A grade means renters hold the most cards, while an F means property owners do.
We focused on 2023 through mid-2026 because that window captures the biggest apartment supply wave in decades. In 2024 alone, builders completed about 590,000 units in buildings with five or more units. That’s the most since 1974, according to U.S. Census Bureau data. Another 470,000 followed in 2025, much higher than the average of about 360,000 a year from 2019 to 2022.
The national picture is clear. In June 2023, none of the 44 U.S. rental markets we tracked earned an A, and only four earned a B. By June 2026, however, three earned an A and 16 earned a B. Overall, 29 of the 44 cities improved their grade, while only three slipped. Meanwhile, the share of large apartment communities offering a month or more of free rent more than doubled, from 10% to 21%. At the same time, one-bedroom rent growth in the average city flipped from +3.7% a year to -1.8%.
Below, we pulled out the markets where the numbers tell the most compelling stories. We also added a few large coastal anchors for contrast.
The strongest renter’s markets in 2026
These markets are among the most renter-friendly, as of June 2026 data. Here, property owners are cutting rents, stacking concessions, and waiting longer to fill new units.
1. Austin, TX
Austin is the strongest renter’s market in the study. It ranks first of the 44 markets and is one of only three with an A. Before this year, it earned a B in each of the three previous Junes. The median 1-bedroom rent is $1,330, down 12.5% ($190) from a year ago. Additionally, more than two in five large communities (42%) offer at least a month free. Meanwhile, 53% of newly listed units are still available after 30 days, the highest share of any market. Census data also puts rental vacancy at 16.9%, roughly one in six rentals.
2. Denver, CO
Denver ranks second, jumping two grades from a C in June 2023 to an A today. In fact, it has earned an A in 10 of the past 15 months. Denver also has the deepest concession market in the study. Specifically, 48% of large communities offer a month or more free, up from 11% three years ago. Meanwhile, the median 1-bedroom rent fell 7.6% to $1,570.
3. Nashville, TN
Nashville, the third A, has earned the top grade in 17 of the 42 months we tracked. That’s more than any other city. Nashville also caps a steady supply story. Rents that were rising 4.1% a year in June 2023 are now falling 7.4%. That brings the median 1-bedroom to $1,500. In addition, a third of large communities (33%) offer at least a month free.
4. Dallas, TX
Dallas ranks fourth with a B. The median 1-bedroom rent is $1,350, down 6.9% year over year. Plus, 47% of new units are still available after a month. New supply also keeps coming. In fact, Dallas permitted 15.6 new homes per 1,000 residents over two years, among the study’s highest rates.
5. Charlotte, NC
Charlotte moved from a C to a B and has held that B every month since January 2024. Rents went from rising 6.1% a year to falling 1.4%. Meanwhile, the share of new units still unrented after 30 days rose from 31% to 51%.
The biggest turnarounds since 2023
These markets gained the most leverage between June 2023 and June 2026. Three years ago, most were landlord-friendly or middling. Today, however, they’re renter’s markets.
6. Miami, FL: from boom to bargaining
In June 2023, Miami’s median 1-bedroom rent was up 19.2% year over year. Today, by contrast, it’s down 3.3% to $2,610. Month-free offers also climbed from 9% to 37% of large communities. Altogether, Miami jumped two grades, from a D to a B.
7. San Antonio, TX
Rental vacancy tripled, from 5.5% to 16.9%, tying Austin for the highest rate in the study. Month-free offers also went from 6% to 38% of large communities. Meanwhile, the median 1-bedroom fell 10.4% to $950. Overall, San Antonio moved from a C to a B.
8. Tucson, AZ
Tucson also moved from a C to a B. For example, the share of large communities offering a month free jumped from 3% to 41%. In addition, half of new units now sit unrented after 30 days, up from 37%. The median 1-bedroom is $900.
9. Los Angeles, CA
LA is the largest coastal market to swing toward renters, moving from a C to a B. The median 1-bedroom fell 4.4% ($100) to $2,200. Meanwhile, the share of new units still available after a month climbed from 34% to 50%. However, vacancy remains tight at 5.1%. So the leverage here comes from concessions and slower leasing, not empty units.
10. Las Vegas, NV
Month-free offers tripled, from 14% to 43% of large communities. Similarly, the share of new units unrented after 30 days more than doubled, from 23% to 49%. As a result, Las Vegas moved from a C to a B.
Two big gainers that are still catching up
11. Cincinnati, OH
Cincinnati is one of only four cities to jump two grades, from an F to a C. Rents that were climbing 11.3% a year in June 2023 are now down 3.5%. Also, 45% of new units sit unrented after a month, up from 22%. Still, a C only puts Cincinnati in the middle of the pack. That’s a sign of how far behind many Midwest markets started.
12. Richmond, VA
Richmond also jumped two grades, from an F to a C. Rents are still inching up, rising 0.7% to $1,410. However, month-free offers jumped from 6% to 26% of large communities. Vacancy also rose from 1.8% to 6.2%. As a result, renters here have more room to negotiate on concessions than on price.
How the big coastal markets compare
While renters gained ground almost everywhere, the country’s priciest rental markets mostly moved the other way. In San Francisco and New York, it’s anything but a renter’s market.
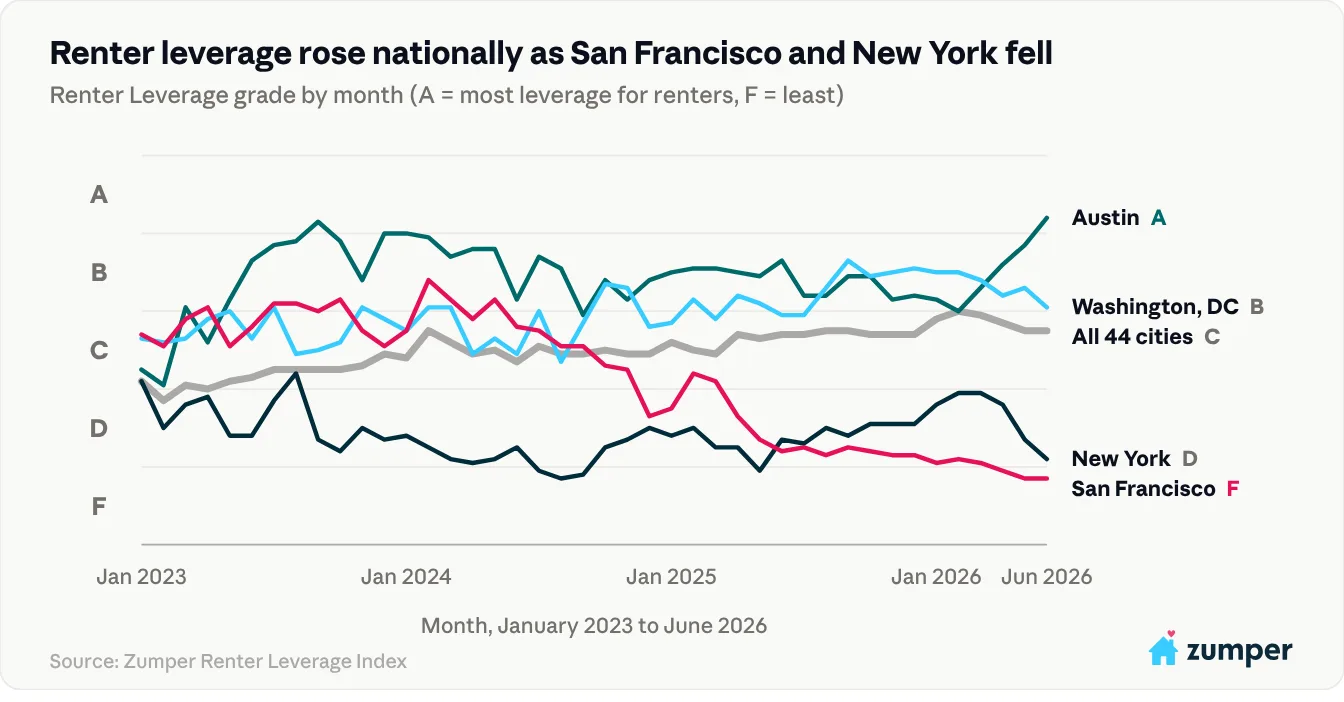
14. San Francisco, CA: the biggest drop in the study
San Francisco fell two grades, from a C to an F, the only drop that steep in the study. It now ranks 43rd of 44 and is one of just two F’s, alongside Virginia Beach. Meanwhile, the median 1-bedroom rent jumped 21.9% ($730) in a year to $4,060. That’s the fastest growth of any market. Month-free offers, available at 15% of large communities in June 2023, have disappeared entirely. Plus, the typical unit that leased in June was on the market for just 11 days. Leverage here peaked in February 2024. It then began sliding late that year as AI-driven hiring brought demand back to the city.
14. New York, NY
New York has earned a D every June from 2023 through 2026 and ranks 42nd. The median 1-bedroom is $4,660, the most expensive in the study. Even so, it’s still up 4.0% ($180) from a year ago. Just 7% of large communities offer a month free. Additionally, only a third of new units (33%) are still available after 30 days, down from 42% in 2023.
15. Washington, DC
DC moved from a C to a B and ranks 18th. Month-free offers doubled, from 18% to 36% of large communities. Meanwhile, the median 1-bedroom is flat at $2,300. DC has held a B every month since August 2025. In fact, its leverage was strongest that fall, when 1-bedroom rents were down nearly 5% year over year.
16. San Jose, CA
San Jose slipped from a C to a D. One quirk, however: 21% of listings show a price drop, the highest share of any city. This suggests property owners are listing high and trimming, rather than offering concessions.
Boston and Chicago
Boston and Chicago also sit near the bottom with D grades. Chicago’s median 1-bedroom rose 10% ($200) to $2,200. That’s the second-fastest rent growth in the study, after San Francisco. Meanwhile, Boston, a D in every June we tracked, has the third-priciest 1-bedroom, at $2,950.
The supply wave is already cresting
Much of the leverage renters have today comes from buildings permitted at the height of the 2021–22 construction boom. Apartment buildings typically take 18 to 24 months to go from permit to move-in.
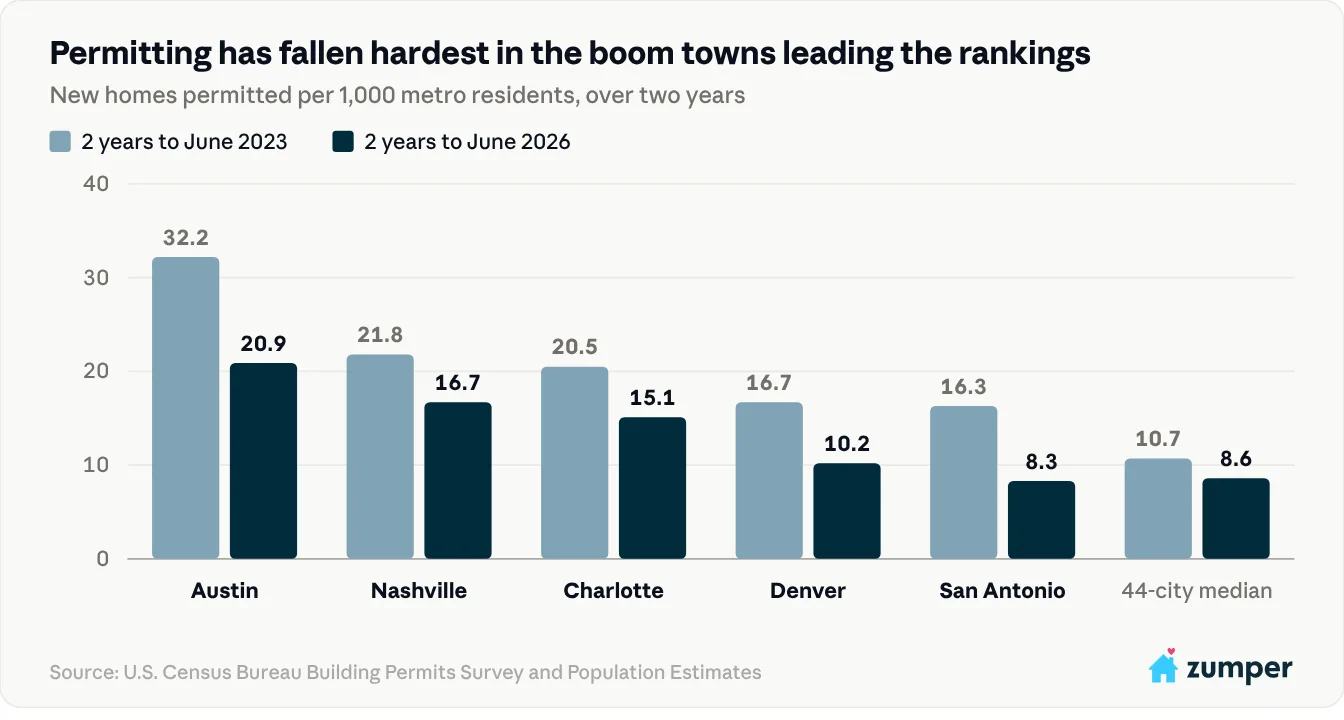
Across all 44 markets, the median metro permitted 8.6 new homes per 1,000 residents in the two years to June 2026. That’s down from 10.7 in the two years to June 2023. Overall, permitting is down in 36 of the 44 metros. Notably, the drop is steepest in the Sun Belt markets leading this year’s rankings. For example, Austin fell from 32.2 to 20.9 homes per 1,000 residents. Denver fell from 16.7 to 10.2, and San Antonio from 16.3 to 8.3.
Year by year, the wave has already crested. Austin permitted 19.4 homes per 1,000 residents in the year to June 2022. By comparison, it permitted 12 in the year to June 2025 and 8.9 in the year to June 2026.
As a result, less new supply is coming behind the current wave. As boom-era buildings fill up, today’s renter’s markets may not last. Property owners may also have less reason to keep offering deals. In fact, renter leverage nationally already peaked in February 2026, when four cities held an A. Since then, it has eased slightly.
What it means for renters
Renter leverage has grown nationally, but it isn’t evenly spread. In Austin, for example, rents are down in the double digits from a year ago. Plus, more than two in five large communities offer a month free. In San Francisco, by contrast, rents are up over 20% and month-free deals have vanished. There, new units lease in about a week and a half. New York renters, meanwhile, haven’t seen a renter-friendly June in the four years we tracked.
If you’re signing a lease in a renter’s market, it’s worth asking about concessions, a lower rent, or flexible terms. That’s especially true at newer buildings still filling up. In low-leverage markets, however, the best move may be to act quickly and budget for competition.
FAQ
Is it a renter’s market in 2026?
In much of the U.S., yes. In Zumper’s Renter Leverage Index, 29 of 44 major rental markets improved their grade between June 2023 and June 2026. However, coastal markets like San Francisco and New York remain tough for renters.
What are the best cities for renters in 2026?
Austin, Denver, and Nashville are the strongest renter’s markets.
Where is it hardest to rent in 2026?
San Francisco and Virginia Beach are the worst, followed by New York, Tulsa, and San Jose.
Why are rents falling in some cities?
In many Sun Belt cities, renter leverage has grown alongside a historic wave of new apartments. To fill those units, many property owners are cutting rents and offering move-in specials.
How common is a month of free rent right now?
In June 2026, 21% of large apartment communities offered at least a month free, up from 10% in June 2023.
Will the renter’s market last?
It won’t last forever as permitting has fallen in 36 of the 44 metros since 2023, so fewer new apartments are on the way. As boom-era buildings fill up, deals may get harder to find.
How can renters negotiate a better deal?
In a renter’s market, ask about move-in specials, a lower monthly rent, or flexible lease terms. Newer buildings that are still filling up tend to have the most room to negotiate. In tighter markets, however, it’s best to act quickly and budget for competition.
What is the Zumper Renter Leverage Index?
It’s a monthly A-to-F grade for 44 major U.S. rental markets. It combines four Zumper listing signals (rent changes, month-free offers, price drops, and time on market) with Census data on rental vacancy and new supply. An A means renters hold the most negotiating power.
Full data
Here’s how renter leverage looks in 44 large U.S. rental markets as of June 2026. Grades run from A (renters hold the most leverage) to F (property owners do). They sit on a fixed scale, so an A in 2023 means the same thing as an A in 2026. Cities are ordered by their June 2026 rank. All figures are for June 2026. The rent change column compares each city’s median 1-bedroom rent with June 2025, one year earlier.
| Rank | City | Grade, June 2026 | Grade, June 2023 | 1-bed median rent, June 2026 | 1-bed rent change, June 2025 to June 2026 | Large communities with 1+ month free | Listings with a price drop | New units still available after 30 days | Rental vacancy rate (Q2) | New homes permitted per 1,000 residents (past 2 years) |
|---|---|---|---|---|---|---|---|---|---|---|
| 1 | Austin, TX | A | B | $1,330 | -12.50% | 42% | 8% | 53% | 16.90% | 20.9 |
| 2 | Denver, CO | A | C | $1,570 | -7.60% | 48% | 16% | 47% | 7.30% | 10.2 |
| 3 | Nashville, TN | A | B | $1,500 | -7.40% | 33% | 11% | 47% | 9.60% | 16.7 |
| 4 | Dallas, TX | B | B | $1,350 | -6.90% | 25% | 10% | 47% | 11.70% | 15.6 |
| 5 | Tampa, FL | B | C | $1,520 | -6.20% | 31% | 12% | 43% | 10.50% | 12.2 |
| 6 | Charlotte, NC | B | C | $1,460 | -1.40% | 34% | 14% | 51% | 7.20% | 15.1 |
| 7 | San Antonio, TX | B | C | $950 | -10.40% | 38% | 8% | 46% | 16.90% | 8.3 |
| 8 | Phoenix, AZ | B | C | $1,200 | -4.00% | 41% | 13% | 43% | 8.00% | 14.7 |
| 9 | Las Vegas, NV | B | C | $1,190 | -1.60% | 43% | 12% | 49% | 7.60% | 10.1 |
| 10 | Houston, TX | B | C | $1,100 | -14.10% | 20% | 9% | 44% | 12.90% | 16 |
| 11 | Tucson, AZ | B | C | $900 | -1.10% | 41% | 9% | 50% | 15.30% | 8.8 |
| 12 | Jacksonville, FL | B | C | $1,130 | -5.00% | 32% | 9% | 39% | 9.30% | 14.7 |
| 13 | Los Angeles, CA | B | C | $2,200 | -4.40% | 29% | 12% | 50% | 5.10% | 4.7 |
| 14 | Miami, FL | B | D | $2,610 | -3.30% | 37% | 8% | 48% | 9.10% | 6 |
| 15 | Seattle, WA | B | C | $1,980 | 1.00% | 37% | 14% | 50% | 5.20% | 8.5 |
| 16 | Orlando, FL | B | C | $1,470 | -8.10% | 24% | 9% | 44% | 3.70% | 16.3 |
| 17 | Raleigh, NC | B | C | $1,290 | 0.00% | 25% | 10% | 41% | 8.90% | 23.8 |
| 18 | Washington, DC | B | C | $2,300 | 0.00% | 36% | 10% | 47% | 6.20% | 6.2 |
| 19 | Indianapolis, IN | B | C | $1,010 | -8.20% | 9% | 10% | 38% | 11.80% | 11.6 |
| 20 | Portland, OR | C | B | $1,400 | -1.40% | 31% | 9% | 44% | 5.70% | 7.1 |
| 21 | Atlanta, GA | C | C | $1,680 | 4.40% | 31% | 11% | 41% | 9.60% | 10.7 |
| 22 | Columbus, OH | C | D | $1,180 | -0.80% | 25% | 9% | 45% | 4.50% | 12.6 |
| 23 | San Diego, CA | C | D | $2,220 | -3.50% | 15% | 15% | 41% | 2.90% | 7.1 |
| 24 | Memphis, TN | C | C | $900 | -10.00% | 11% | 8% | 39% | 10.10% | 5.4 |
| 25 | Philadelphia, PA | C | C | $1,470 | -3.90% | 13% | 6% | 49% | 6.60% | 4.3 |
| 26 | Sacramento, CA | C | C | $1,500 | 0.00% | 22% | 8% | 44% | 4.50% | 8.6 |
| 27 | Cincinnati, OH | C | F | $1,100 | -3.50% | 14% | 8% | 45% | 2.30% | 6.7 |
| 28 | Minneapolis, MN | C | C | $1,280 | 1.60% | 17% | 7% | 47% | 6.90% | 7.7 |
| 29 | Kansas, City, MO | C | D | $1,140 | 0.90% | 9% | 6% | 48% | 9.10% | 8.6 |
| 30 | Richmond, VA | C | F | $1,410 | 0.70% | 26% | 5% | 40% | 6.20% | 13.3 |
| 31 | Omaha, NE | C | D | $1,020 | 0.00% | 14% | 7% | 46% | 3.40% | 13.6 |
| 32 | Oklahoma City, OK | C | D | $880 | -2.20% | 12% | 5% | 41% | 7.20% | 10.4 |
| 33 | Albuquerque, NM | C | D | $980 | 3.20% | 17% | 6% | 45% | 6.90% | 6.3 |
| 34 | Baltimore, MD | C | D | $1,250 | -3.80% | 8% | 5% | 43% | 6.10% | 4.4 |
| 35 | Knoxville, TN | C | D | $1,200 | -1.60% | 18% | 8% | 33% | 1.70% | 15.5 |
| 36 | Louisville, KY | C | D | $1,050 | -0.90% | 13% | 7% | 35% | 7.90% | 8.5 |
| 37 | Boston, MA | D | D | $2,950 | 3.50% | 10% | 6% | 46% | 7.00% | 4 |
| 38 | Detroit, MI | D | D | $940 | -6.90% | 0% | 3% | 40% | 7.70% | 3.9 |
| 39 | Chicago, IL | D | D | $2,200 | 10.00% | 6% | 8% | 48% | 6.60% | 3.5 |
| 40 | San Jose, CA | D | C | $2,760 | 2.60% | 0% | 21% | 36% | 0.50% | 5.6 |
| 41 | Tulsa, OK | D | D | $930 | 2.20% | 0% | 6% | 35% | 5.20% | 8.9 |
| 42 | New York, NY | D | D | $4,660 | 4.00% | 7% | 7% | 33% | 5.50% | 5.2 |
| 43 | San Francisco, CA | F | C | $4,060 | 21.90% | 0% | 12% | 25% | 4.20% | 3.2 |
| 44 | Virginia Beach, VA | F | F | $1,690 | 7.60% | 0% | 6% | 27% | 7.70% | 5.5 |
Methodology
To measure where renters have the most negotiating power in 2026, we built the Zumper Renter Leverage Index. It covers 44 major U.S. rental markets, using data for every month from January 2023 through June 2026. June 2026 is the most recent month with Census vacancy data.
The Six Metrics
Each metric is oriented so that a higher reading means more leverage for renters. Four come from Zumper data and carry 20 points each. The other two come from the U.S. Census Bureau and carry 20 points between them.
- Rent change (20 points): year-over-year change in the median 1-bedroom asking rent, as published in the Zumper National Rent Report. Lower is better for renters.
- Month-free offers (20 points): the share of large (50+ unit) apartment communities advertising four or more weeks of free rent on a given day. Higher is better for renters.
- Price drops (20 points): the share of active listings priced at least 5% or $100 below their highest asking rent of the prior 30 days. Higher is better for renters.
- Time on market (20 points): the share of newly listed units (on Zumper for more than three days) still available 30 days later. Higher is better for renters.
- Rental vacancy (12 points): the metro rental vacancy rate from the Census Housing Vacancy Survey, published quarterly.
- New supply (8 points): housing units permitted per 1,000 metro residents over the rolling 24 months ending in the reporting month. Because apartment buildings typically take 18 to 24 months to complete, this window captures supply coming online now. It also captures supply likely to arrive in the months that follow.
Metrics Converted to Scores
First, we seasonally adjusted the three metrics that swing with the calendar: month-free offers, price drops, and time on market. These bottom out in spring and peak in late fall. For each one, the adjustment worked as follows:
- Calculate an average value for each calendar month across all 44 cities from 2023 to 2025 [A].
- Calculate the overall average across all cities and all months (city-months) from 2023 to 2025 [B].
- Take the difference, [A] − [B], as that calendar month’s seasonality factor [C].
- Subtract the factor for the observation’s calendar month from every observed value: seasonally adjusted value = observed value − [C].
The factors are estimated on the three complete years only. However, they’re applied to every month in the study, including January through June 2026. For example, for time on market the June factor is -3.8 points and the December factor is +7.3. So a December reading is pulled down and a June reading nudged up before ranking.
Ranking and weighting
Next, we converted each metric (seasonally adjusted, where needed) to a percentile rank across every city-month in the study (44 cities × 42 months). On this scale, 100 is the most renter-friendly reading observed anywhere in the period. Ranking across the whole period, rather than within each month, keeps the scale consistent. That means a score of 70 carries the same meaning in 2023 as in 2026. As a result, cities can be compared with their own past as well as with each other.
The Renter Leverage Score is then the weighted average of the six percentile ranks. The table below shows each metric’s weight.
| Metric | Weight |
|---|---|
| Rent change | 20% |
| Month-free offers | 20% |
| Price drops | 20% |
| Time on market | 20% |
| Rental vacancy | 12% |
| New supply | 8% |
How grades are assigned
Within each month, cities are ranked by score (1 = most renter leverage). Grades are fixed bands of the score, rounded to the nearest whole number. An A is 80 and above, a B is 60 to 79, and a C is 40 to 59. A D is 20 to 39, and an F is below 20. Because the score sits on one scale for the whole period, a B means the same thing in 2023 as in 2026. We also build the seasonal adjustments into the final scores. Still, a city-month can show an unusual seasonal spike or dip. So we compare like months across time (for example, June 2026 vs. June 2023).
Which Cities Were Included
We started with the 100 cities in the Zumper National Rent Report and kept 44. First, we removed 23 whose metro isn’t in the Census vacancy survey for every month of the period. Next, we removed 20 that share a metro with a larger principal city, such as Oakland, Fort Worth, and Newark. Finally, we removed 13 where move-in specials couldn’t be measured consistently across the full period.
Data Sources
- Median rent: Zumper National Rent Report, median 1-bedroom asking rent per city.
- Month-free offers, price drops, and time on market: Zumper listing data, including building specials, listing price histories, and daily unit availability.
- Rental vacancy rate: U.S. Census Bureau: Housing Vacancies and Homeownership (CPS/HVS), quarterly rental vacancy rates for the 75 largest metropolitan areas.
- New housing units permitted: U.S. Census Bureau: Building Permits Survey, units authorized by metro area (CBSA).
- Metro population: U.S. Census Bureau: Population and Housing Unit Estimates, used to put permits on a per-1,000-residents basis.
Footnotes
- Rent, month-free offers, price drops, and time on market are measured at the city level from Zumper data. Vacancy and permits are measured at the metro level, the smallest geography the Census publishes them for.
- Month-free offers are counted only among 50+ unit communities that report the rent specials they offer.
- Census metro vacancy rates are survey estimates with wide margins of error, often several percentage points. For example, the margin was ±4.9 points for Austin and ±5.3 for San Antonio in Q2 2026. Each quarter’s rate is applied to all three months of that quarter. This is one reason vacancy carries less weight than the Zumper metrics.
- For time on market, a unit counts as still available while it remains listed on Zumper.
- The same cities lead and trail the list under other weightings. Specifically, we tested equal weights, Zumper-only weights, and a version that gives rent change less weight. Each alternative ranking correlated with the headline ranking at 0.95 or higher.
Related content