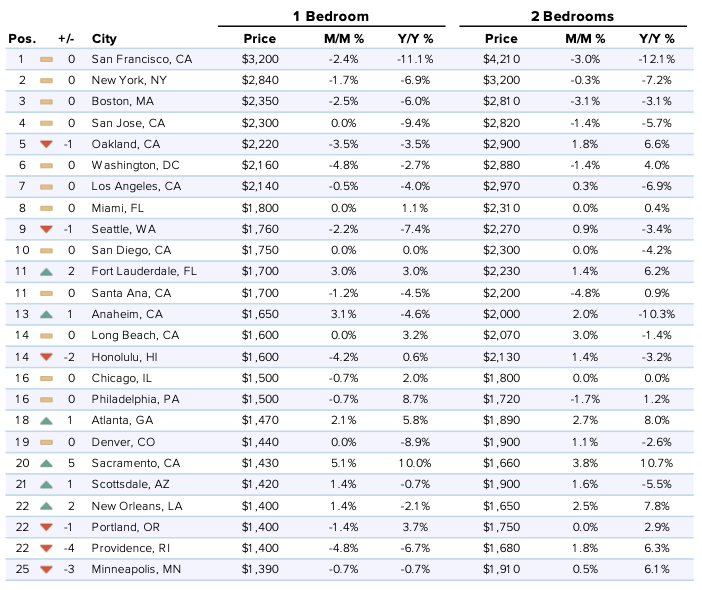
Rent decreases have accelerated in the country’s most expensive cities.
For one-bedroom apartments, 7 of the 10 priciest markets had larger year-over-year percentage decreases than the month prior, with an average of -5%. Additionally, 5 of these cities had larger month-over-month percent decreases this month than last. None of the 10 most expensive cities experienced an increase in median rent from last month. Notably, the two priciest markets continued their downward trajectories with San Francisco and New York City one-bedroom rents down 11% and 7%, respectively, since this time last year.
Rents in less expensive cities have been on the rise.
In stark contrast to the nation’s most expensive cities, median rents in less expensive cities have been steadily increasing. Of the top 10 least expensive cities in the 100 tracked in this report, only one city, Tulsa, had a decrease in median rent for one-bedrooms, and growth averaged 5.2% in year-over-year terms.
COVID-19 is causing a “squeezing” effect on U.S. rental prices.
The result of the above 2 effects is a “squeezing” of the price distribution of rentals across the country as historically expensive cities become cheaper and historically cheaper cities become more expensive. This effect has continued to accelerate this month as COVID-19 persists on and more Americans are opting for cheaper places to live while working from home or away from their offices.
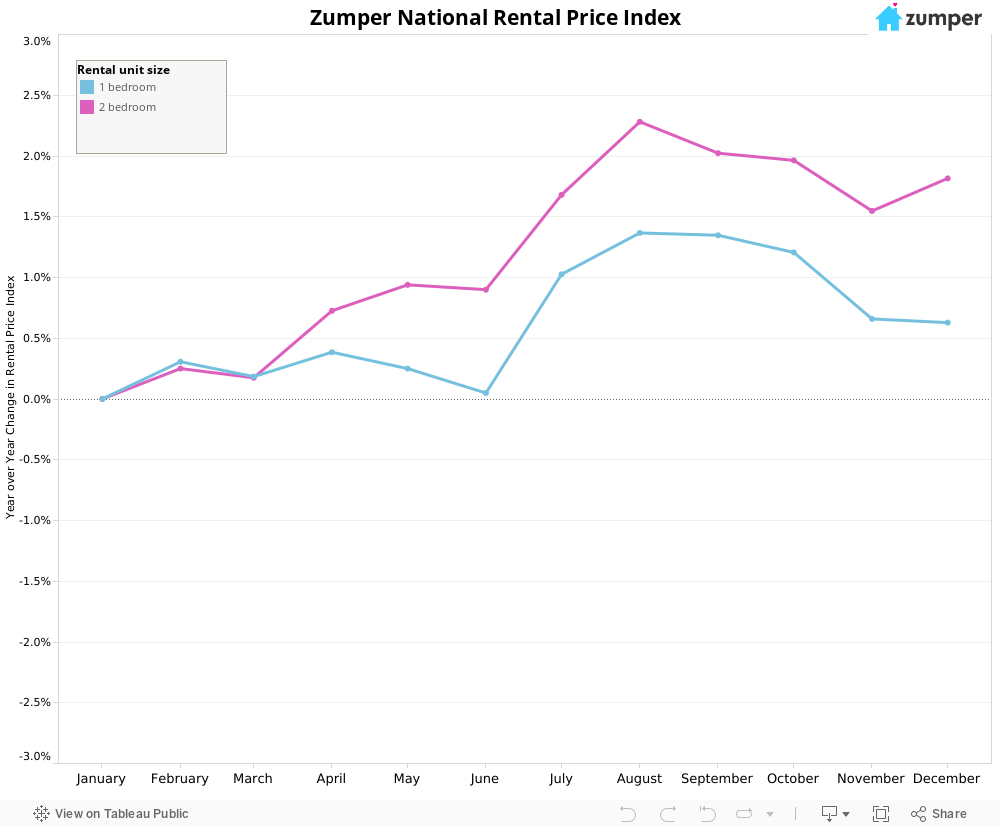
Nationally, median rents continue to tick up during summer moving season.
Overall, the national one-bedroom rent increased 0.3% to a median of $1,233, while two-bedrooms grew 0.6% to $1,493. On a year-to-date basis, one and two-bedroom prices are up 0.7% and 1%, respectively.
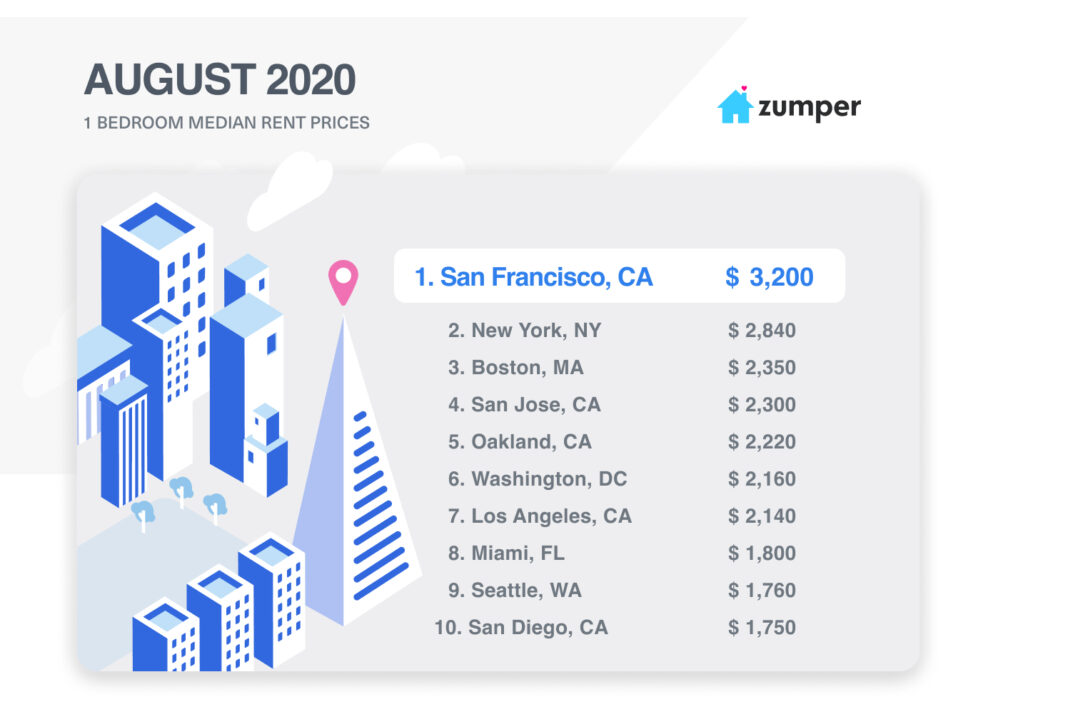
Top 5 Rental Markets
1. San Francisco, Californie one-bedroom rent dropped another 2.4% last month to $3,200, while two-bedrooms decreased 3% to $4,210. Notably, both one and two-bedroom rents are now down over 11% since this time last year.
2. New York, NY, similar to San Francisco, continued to see rents drop with one-bedrooms declining 1.7% to $2,840 and two-bedrooms decreasing 0.3% to $3,200. Both one and two-bedroom prices in this city have fallen around 7% year-over-year.
3. Boston, Massachusetts saw one-bedroom rent drop 2.5% to $2,350, while two-bedrooms dipped 3.1% to $2,810.
4. San Jose, CA held on as the 4th priciest market with one-bedroom rent remaining flat at $2,300, while two-bedrooms decreased 1.4% to $2,820.
5. Oakland, CA moved down 1 spot to become the 5th most expensive market with one-bedroom rent falling 3.5% to $2,220, while two-bedrooms grew 1.8% to $2,900.
Notable Changes This Past Month
Upward
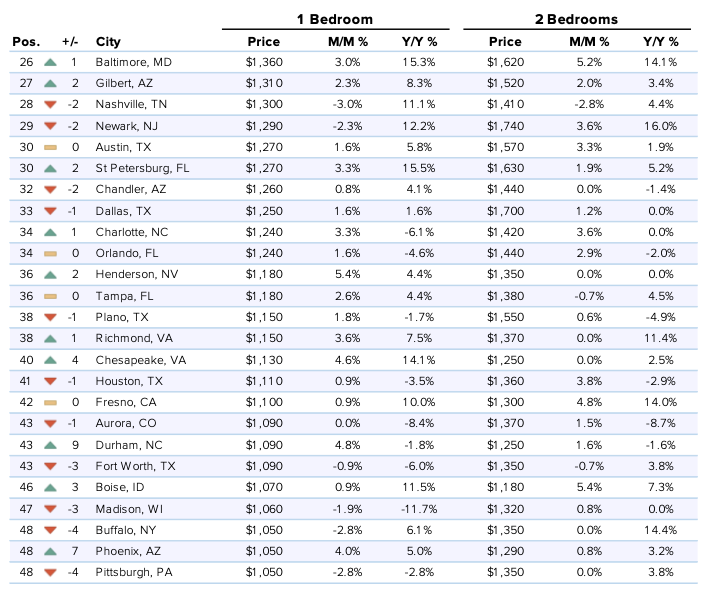
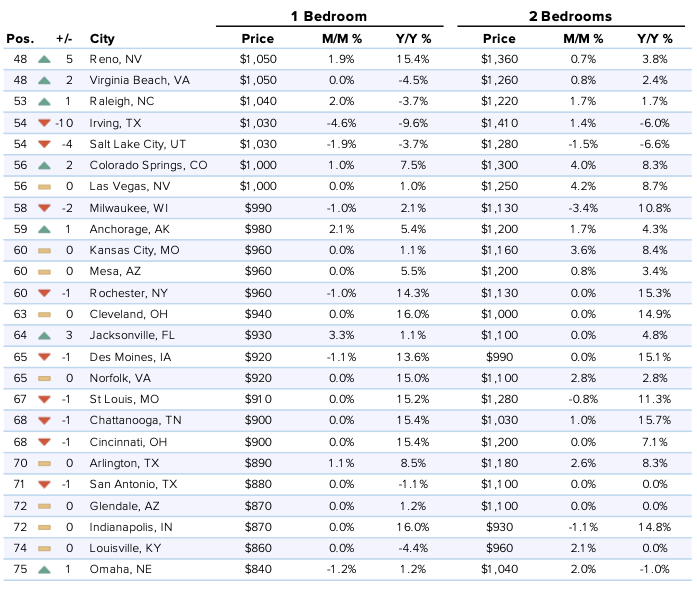
–Henderson, NV saw one-bedroom rent climb 5.4%, which was the largest monthly growth rate in the nation, to settle at $1,180 and move up 2 spots to rank as 36th.
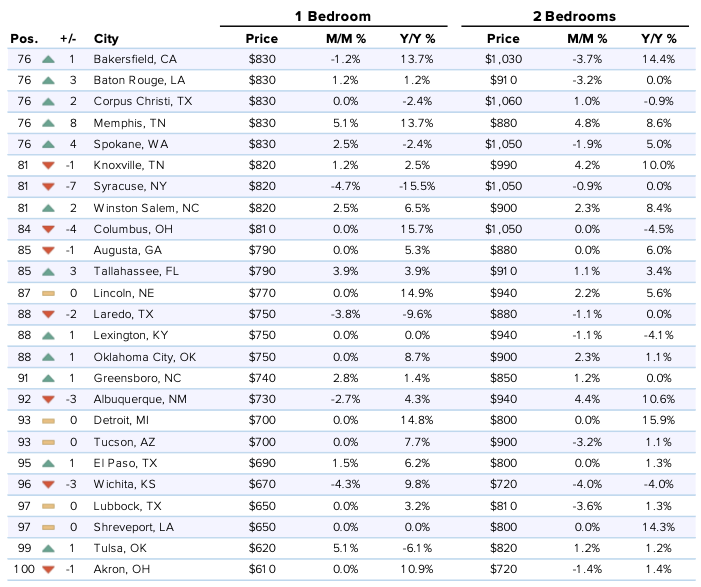
–Tulsa, OK inched up 1 position to become the 99th priciest market with one-bedroom rent growing 5.1% to $620 and two-bedrooms increasing 1.2% to $820.
–Sacramento, CA one-bedroom rent grew 5.1%, settling at $1,430, and moved up 5 rankings to 20th. Two-bedroom rent increased 3.8% to $1,660.
–Memphis, TN was catapulted up 8 spots to rank as 76th. One-bedroom rent jumped 5.1% to $820, while two-bedrooms climbed 4.8% to $880.
–Durham, NC moved up 9 positions to 43rd with one-bedroom rent growing 4.8% to $1,090. Two-bedroom rent had a more modest growth rate, increasing 1.6% to $1,250.
Downward
–Providence, RI moved down 4 spots to rank as the 22nd priciest city and tied with Washington D.C. for the largest rental decline last month, falling 4.8% to $1,400.
–Washington D.C. remained the 6th priciest market and similar to Providence, saw rent drop 4.8%, settling at $2,160, while two-bedrooms decreased 1.4% to $2,880.
–Syracuse, NY took a 7 ranking plunge to 81st with one-bedroom rent falling 4.7% to $820 and two-bedroom rent decreasing 0.9% to $1,050.
–Irving, TX dropped 10 spots to become the 54th most expensive market with one-bedroom rent dipping 4.6% to $1,030.
–Wichita, KS saw one-bedroom rent fall 4.3%, settling at $670, and down 3 positions to rank as 96th. Two-bedrooms decreased 4% to $720.
About
The Zumper National Rent Report analyzes rental data from over 1 million active listings across the United States. Data is aggregated on a monthly basis to calculate median asking rents for the top 100 metro areas by population, providing a comprehensive view of the current state of the market. The report is based on all data available in the month prior to publication.
If you’re interested in a more in-depth explanation of how and why we calculate our rent data, view our methodology post.
To keep up to date with rent changes across the country, like or follow Zumper on Facebook, Gazouillement, and Instagram. In the market for a new place? Search apartments for rent on Zumper.
Contenu associé