The Zumper SF Bay Area Metro Report analyzed active listings in May across 30 metro cities to show the most and least expensive cities and cities with the fastest growing rents.
Cities Ranked By Rent
The Most Expensive
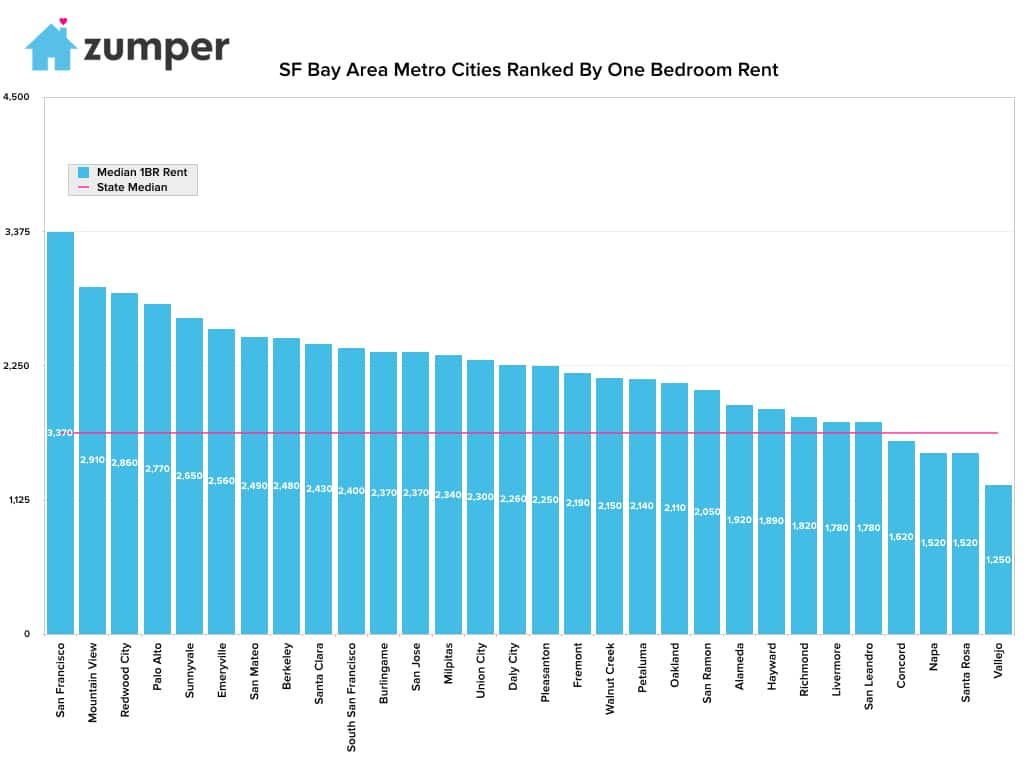
–San Francisco, Californie rent stayed flat last month and continued to rank as the priciest in the metro area at $3,370.
–Mountain View, CA rent grew 5.1% to $2,910 and jumped two spots to become the second most expensive city to rent.
–Redwood City, CA was third with one bedrooms priced at $2,860.
The Least Expensive
–Vallejo, CA rent dropped $50 last month to $1,250 and continued to rank as the most affordable,
–Napa & Santa Rosa, CA tied for the second least expensive city with rent both at $1,520.
–Concord, CA had the third most affordable rent at $1,620.
Growth Rate
The Fastest Growing (Y/Y%)
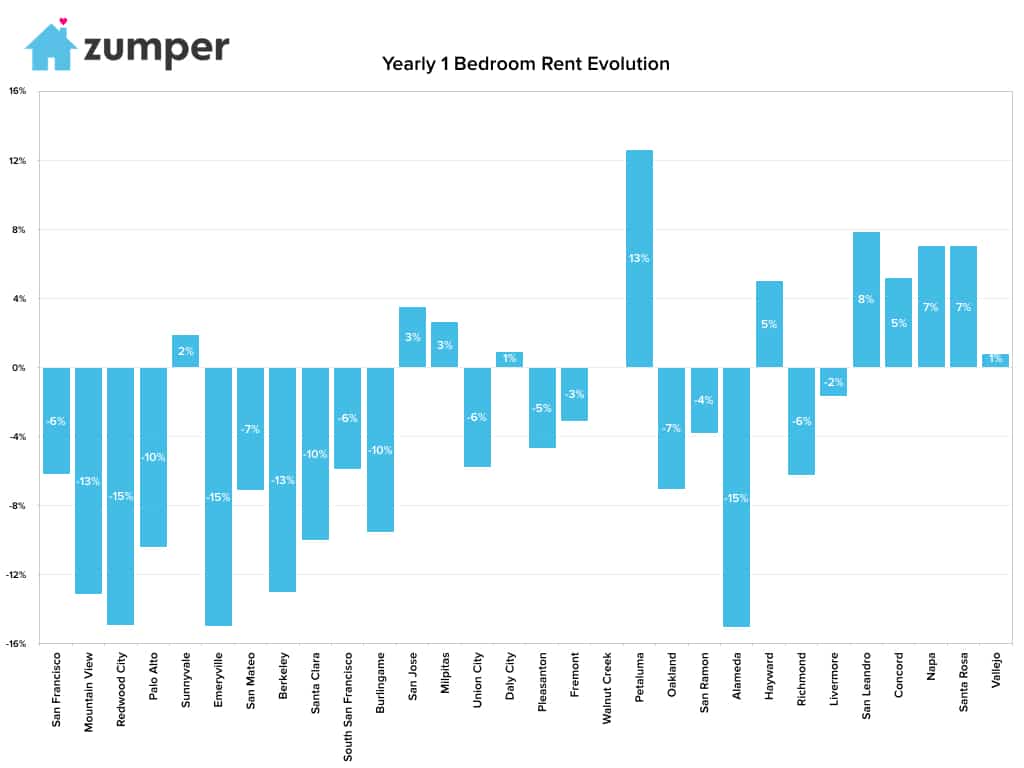
–Petaluma, CA had the fastest growing rent since this time last year, up 12.6%.
–San Leandro, CA had the second largest yearly growth rate, climbing 7.9%.
–Napa & Santa Rosa, CA were tied for the third fastest growing rent, both up 7% since this time last year.
The Fastest Growing (M/M%)
–Mountain View & Pleasanton, CA rent tied for the fastest growing since last month, climbing 5.1%.
–Union City, CA followed closely behind with a 5% monthly growth rate.
–Emeryville & San Jose, CA rent tied for the third fastest growing, both up 4.9% since last month.
Full Data
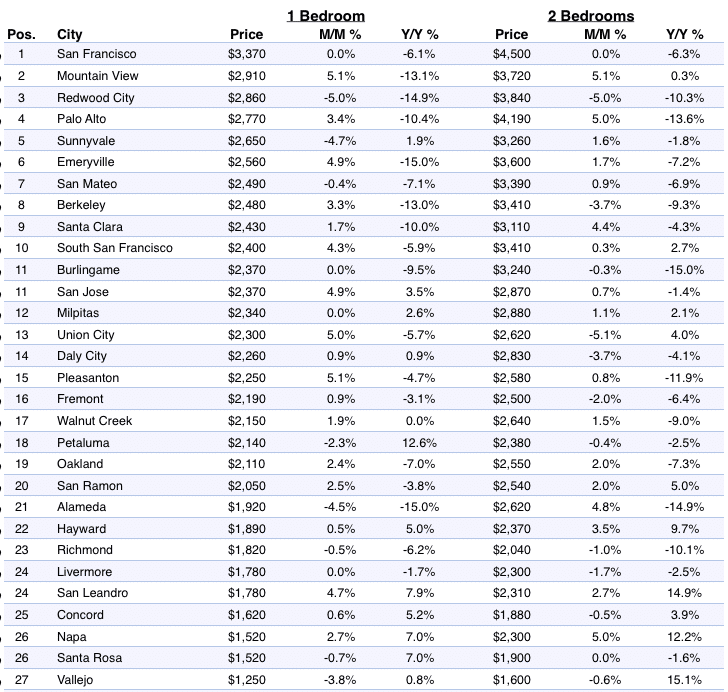
| 1 Bedroom | 2 Bedrooms | ||||||
|---|---|---|---|---|---|---|---|
| Pos. | City | Price | M/M % | Y/Y % | Price | M/M % | Y/Y % |
| 1 | Dallas | $1.280 | -0,8% | 4,9% | $1.750 | -0,6% | 6,7% |
| 2 | Richardson | $1.260 | 0,0% | 9,6% | $1.590 | -1,9% | 13,6% |
| 3 | Frisco | $1.130 | 0,0% | 8,7% | $1.480 | -0,7% | 0,0% |
| 4 | Irving | $1.110 | -0,9% | 7,8% | $1.400 | -2,1% | 9,4% |
| 5 | Plano | $1.080 | -0,9% | 2,9% | $1.450 | 0,0% | 4,3% |
| 6 | Carrollton | $980 | 0,0% | 3,2% | $1.160 | -1,7% | -4,9% |
| 7 | Mckinney | $960 | 0,0% | 0,0% | $1.330 | 0,8% | 2,3% |
| 8 | Fort Worth | $920 | -3,2% | 9,5% | $1.100 | -2,7% | 10,0% |
| 9 | Denton | $890 | 2,3% | 4,7% | $1.050 | 0,0% | 5,0% |
| 10 | Lewisville | $840 | -1,2% | -11,6% | $1.100 | -0,9% | -11,3% |
| 11 | Garland | $750 | -1,3% | -9,6% | $1.000 | 5,3% | -1,0% |
| 12 | Grand Prairie | $710 | 2,9% | -15,5% | $930 | -1,1% | -9,7% |
| 13 | Arlington | $680 | 0,0% | -8,1% | $920 | 0,0% | -3,2% |
| 14 | Mesquite | $650 | 0,0% | -8,5% | $930 | 3,3% | 0,0% |
About
The Zumper SF Bay Area Metro Report analyzed active listings that hit the market in May 2017. Listings are aggregated by city to calculate median asking rents.
In the market for a new place? Search all San Francisco apartments for rent on Zumper now.
Stay up to date with Zumper by following us on Facebook, Gazouillement, Instagram, & Pinterest.
Contenu associé