The Zumper SF Bay Area Metro Report analyzed active listings in December 2018 across 30 metro cities to show the most and least expensive cities and cities with the fastest growing rents. The California one bedroom median rent last month was $1,780.
Cities Ranked By Rent
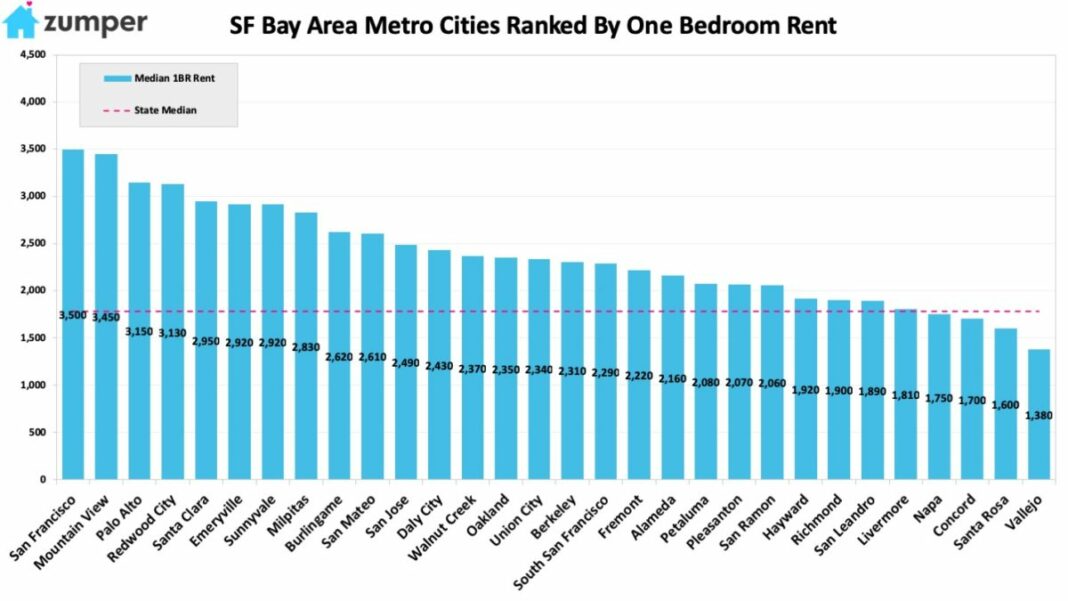
The Most Expensive
–San Francisco, Californie rent dropped $60 to $3,500 but remained the most expensive in the metro.
–Mountain View, CA was second with rent dropping $50 to $3,450.
–Palo Alto, CA moved up one spot, outpacing Redwood City, to rank in the top three markets with one bedrooms priced at $3,150.
The Least Expensive
–Vallejo, CA saw rent fall $70 to $1,380 and continue to be the most affordable city.
–Santa Rosa, CA ranked as second with rent at $1,600.
–Concord, CA rent remained flat at $1,700 and as the third most affordable.
Growth Rate
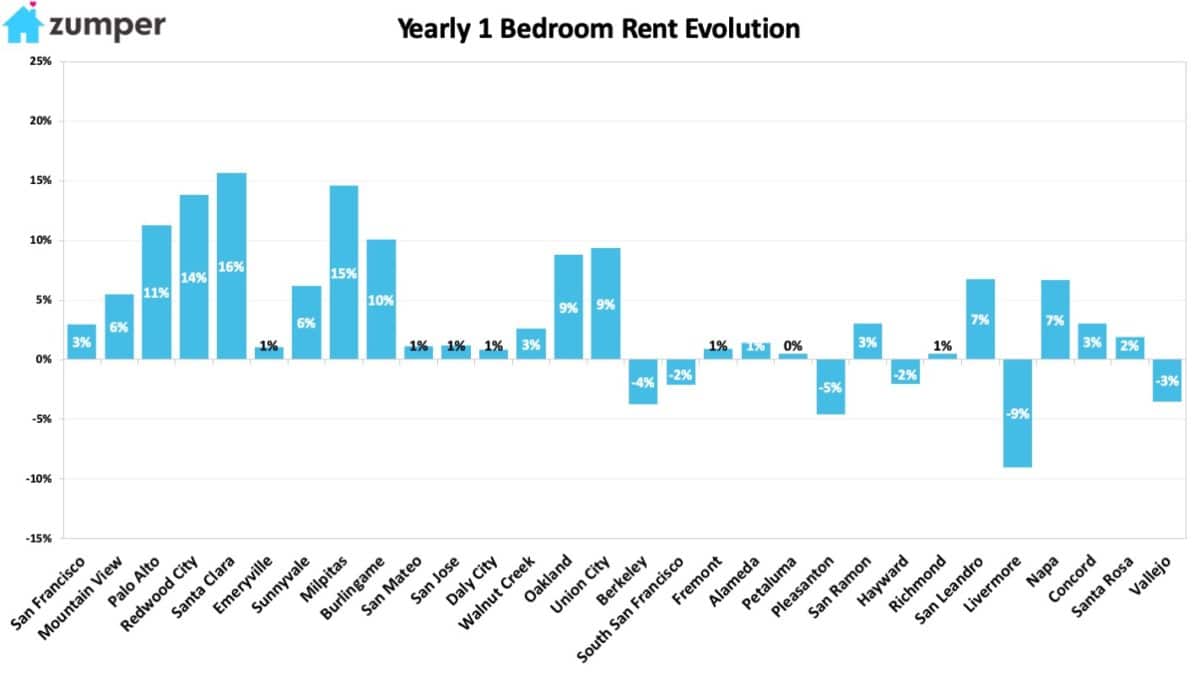
The Fastest Growing (Y/Y%)
–Santa Clara, CA had the fastest growing rent, up 15.7% since this time last year.
–Milpitas, CA rent followed closely behind as the second fastest growing, climbing 14.6%.
–Redwood City, CA was third with rent jumping 13.8%.
The Fastest Growing (M/M%)
–Palo Alto & San Leandro, CA tied for the city with the fastest growing rent last month, both with prices up 5%.
–Sunnyvale, CA had the second largest monthly rental growth rate, increasing 4.3%.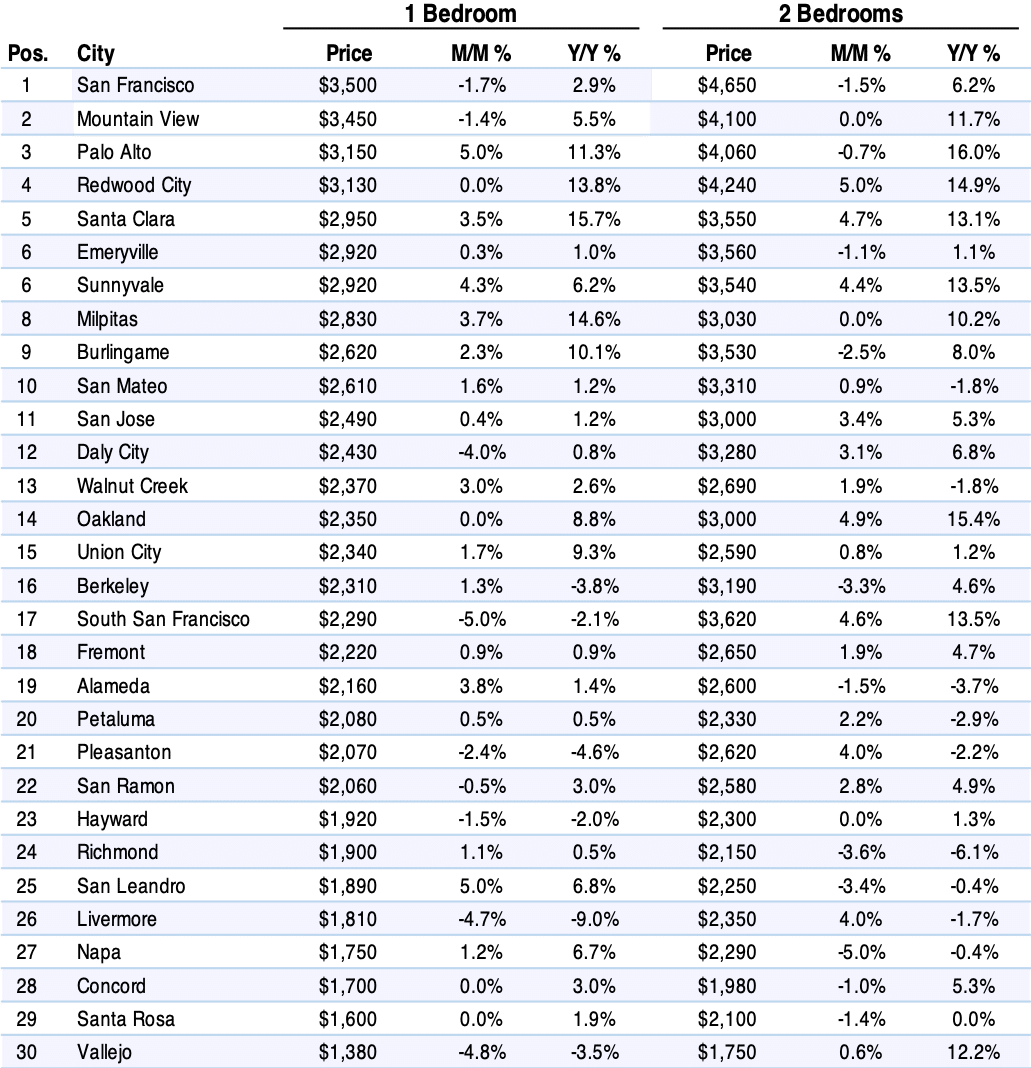
Full Data
| 1 Bedroom | 2 Bedrooms | ||||||
|---|---|---|---|---|---|---|---|
| Pos. | City | Price | M/M % | Y/Y % | Price | M/M % | Y/Y % |
| 1 | San Francisco | $3,500 | -1.70% | 2.90% | $4,650 | -1.50% | 6.20% |
| 2 | Mountain View | $3,450 | -1.40% | 5.50% | $4,100 | 0.00% | 11.70% |
| 3 | Palo Alto | $3,150 | 5.00% | 11.30% | $4,060 | -0.70% | 16.00% |
| 4 | Redwood City | $3,130 | 0.00% | 13.80% | $4,240 | 5.00% | 14.90% |
| 5 | Santa Clara | $2,950 | 3.50% | 15.70% | $3,550 | 4.70% | 13.10% |
| 6 | Emeryville | $2,920 | 0.30% | 1.00% | $3,560 | -1.10% | 1.10% |
| 6 | Sunnyvale | $2,920 | 4.30% | 6.20% | $3,540 | 4.40% | 13.50% |
| 8 | Milpitas | $2,830 | 3.70% | 14.60% | $3,030 | 0.00% | 10.20% |
| 9 | Burlingame | $2,620 | 2.30% | 10.10% | $3,530 | -2.50% | 8.00% |
| 10 | San Mateo | $2,610 | 1.60% | 1.20% | $3,310 | 0.90% | -1.80% |
| 11 | San Jose | $2,490 | 0.40% | 1.20% | $3,000 | 3.40% | 5.30% |
| 12 | Daly City | $2,430 | -4.00% | 0.80% | $3,280 | 3.10% | 6.80% |
| 13 | Walnut Creek | $2,370 | 3.00% | 2.60% | $2,690 | 1.90% | -1.80% |
| 14 | Oakland | $2,350 | 0.00% | 8.80% | $3,000 | 4.90% | 15.40% |
| 15 | Union City | $2,340 | 1.70% | 9.30% | $2,590 | 0.80% | 1.20% |
| 16 | Berkeley | $2,310 | 1.30% | -3.80% | $3,190 | -3.30% | 4.60% |
| 17 | South San Francisco | $2,290 | -5.00% | -2.10% | $3,620 | 4.60% | 13.50% |
| 18 | Fremont | $2,220 | 0.90% | 0.90% | $2,650 | 1.90% | 4.70% |
| 19 | Alameda | $2,160 | 3.80% | 1.40% | $2,600 | -1.50% | -3.70% |
| 20 | Petaluma | $2,080 | 0.50% | 0.50% | $2,330 | 2.20% | -2.90% |
| 21 | Pleasanton | $2,070 | -2.40% | -4.60% | $2,620 | 4.00% | -2.20% |
| 22 | San Ramon | $2,060 | -0.50% | 3.00% | $2,580 | 2.80% | 4.90% |
| 23 | Hayward | $1,920 | -1.50% | -2.00% | $2,300 | 0.00% | 1.30% |
| 24 | Richmond | $1,900 | 1.10% | 0.50% | $2,150 | -3.60% | -6.10% |
| 25 | San Leandro | $1,890 | 5.00% | 6.80% | $2,250 | -3.40% | -0.40% |
| 26 | Livermore | $1,810 | -4.70% | -9.00% | $2,350 | 4.00% | -1.70% |
| 27 | Napa | $1,750 | 1.20% | 6.70% | $2,290 | -5.00% | -0.40% |
| 28 | Concord | $1,700 | 0.00% | 3.00% | $1,980 | -1.00% | 5.30% |
| 29 | Santa Rosa | $1,600 | 0.00% | 1.90% | $2,100 | -1.40% | 0.00% |
| 30 | Vallejo | $1,380 | -4.80% | -3.50% | $1,750 | 0.60% | 12.20% |
About
The Zumper SF Bay Area Metro Report analyzed active listings that hit the market last month. Listings are aggregated by city to calculate median asking rents.
In the market for a new place? Search all San Francisco apartments for rent on Zumper now.
Stay up to date with Zumper by following us on Facebook, Gazouillement, Instagram, & Pinterest.
Contenu associé