The Zumper SF Bay Area Metro Report analyzed active listings in January across 30 metro cities to show the most and least expensive cities and cities with the fastest growing rents. The California one bedroom median rent last month was $1,823.
Cities Ranked By Rent
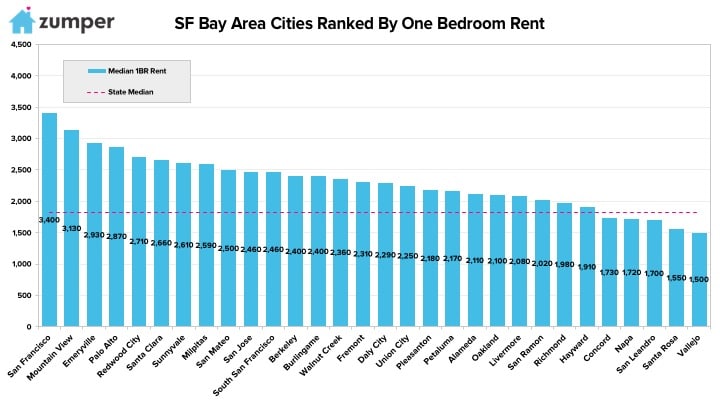
The Most Expensive
–San Francisco, Californie rent remained flat at $3,400 and continued to rank as the most expensive in the metro.
–Mountain View, CA rent grew $140 to $3,270 and held onto its position as the second priciest.
–Emeryville, CA was third with rent at $2,930.
The Least Expensive
–Vallejo, CA rent grew $70 to $1,500 but remained the most affordable in the metro, just $50 shy of Santa Rosa’s.
–Santa Rosa, CA followed closely behind as second with one bedrooms priced at $1,550.
–San Leandro, CA fell behind Napa to rank as the third least expensive city with rent at $1,700.
Growth Rate
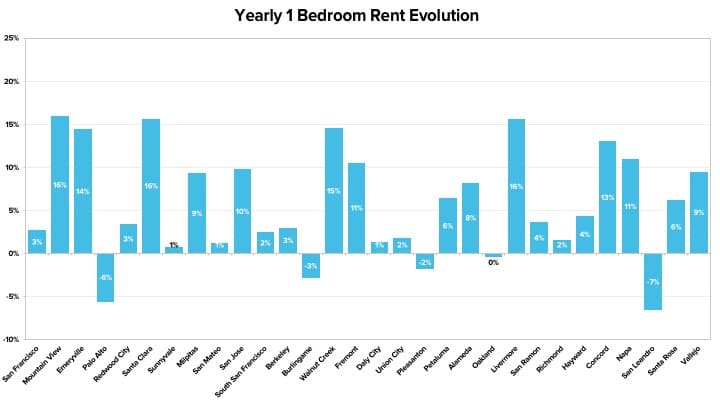
The Fastest Growing (Y/Y%)
–Mountain View, CA had the fastest growing rent since this time last year, up 15.9%.
–Santa Clara, CA followed closely behind as second with rent climbing 15.7%.
–Livermore, CA ranked as third with rent growing 15.6%.
The Fastest Growing (M/M%)
–South San Francisco & Union City, CA tied for the city with the largest monthly rental growth rate, both up 5.1%.
–Fremont, CA had the second fastest growing rent last month, climbing 5%.
–Napa, Milpitas, &Vallejo, CA all tied for third with prices growing 4.9%.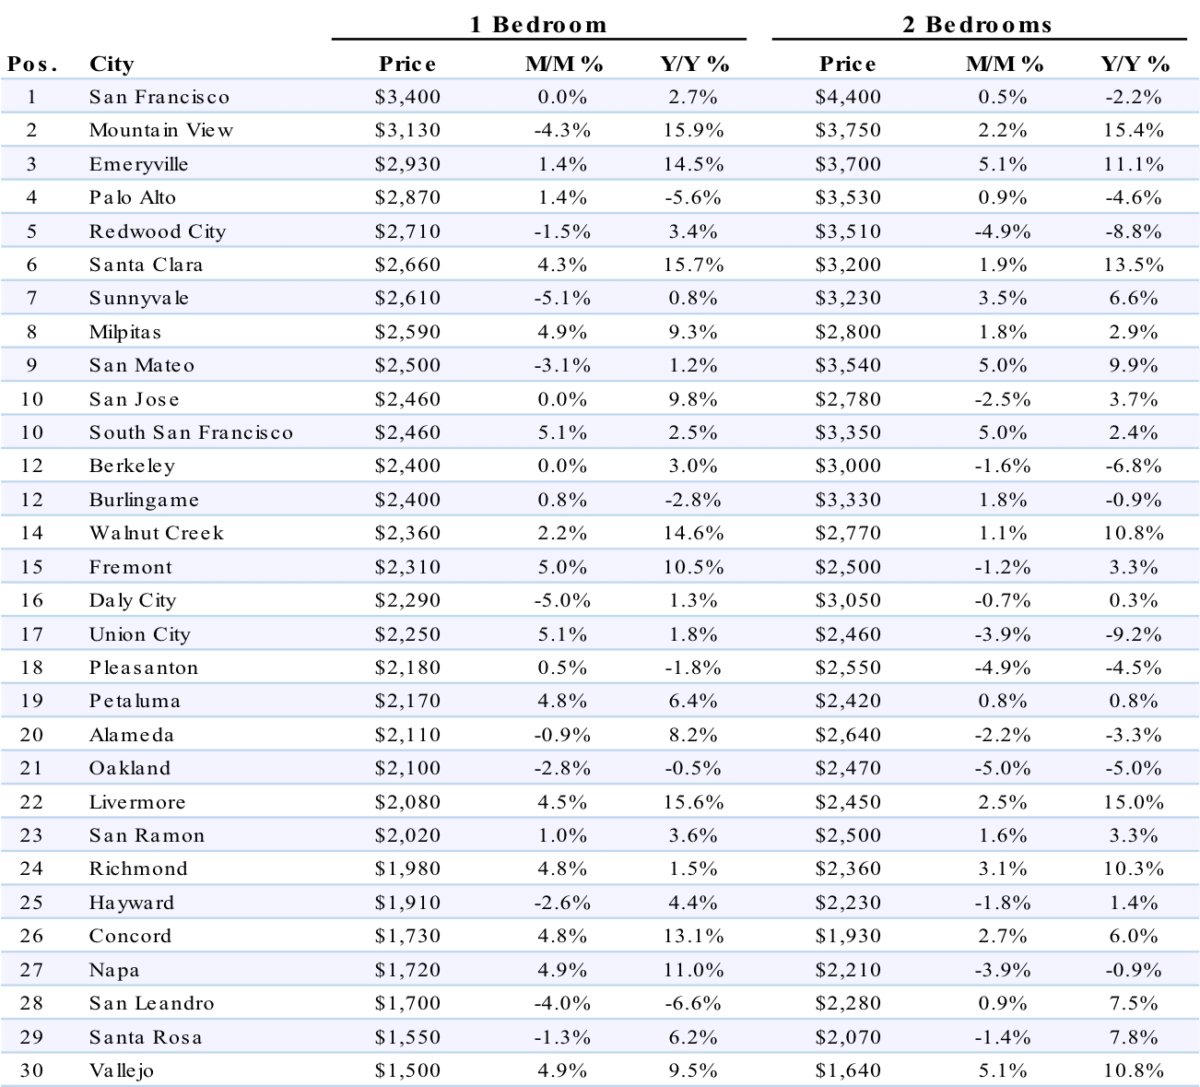
Full Data
| 1 Bedroom | 2 Bedrooms | ||||||
|---|---|---|---|---|---|---|---|
| Pos. | City | Price | M/M % | Y/Y % | Price | M/M % | Y/Y % |
| 1 | San Francisco, Californie | $3,400 | 0.00% | 2.40% | $4,510 | 2.50% | 1.80% |
| 2 | New York, NY | $2,900 | 0.00% | -1.40% | $3,500 | 1.70% | 0.30% |
| 3 | San Jose, CA | $2,470 | 0.80% | 9.30% | $2,940 | 3.90% | 4.30% |
| 4 | Boston, Massachusetts | $2,300 | 0.00% | 4.50% | $2,700 | 0.00% | 3.80% |
| 5 | Los Angeles, Californie | $2,250 | 2.30% | 9.20% | $3,200 | 0.00% | 8.50% |
| 6 | Oakland, CA | $2,130 | -0.50% | 2.90% | $2,470 | 5.10% | -3.10% |
| 6 | Washington, D.C. | $2,130 | -4.10% | 4.40% | $2,700 | -3.90% | -6.90% |
| 8 | Seattle, WA | $1,890 | 5.00% | 4.40% | $2,500 | 4.60% | 4.20% |
| 9 | San Diego, CA | $1,800 | 0.00% | 13.90% | $2,320 | 3.10% | 5.50% |
| 10 | Miami, Floride | $1,730 | -3.40% | -3.90% | $2,370 | -1.30% | -5.20% |
| 11 | Honolulu, HI | $1,700 | 3.00% | -4.50% | $2,200 | 0.00% | -7.90% |
| 12 | Fort Lauderdale, FL | $1,550 | 3.30% | -1.30% | $1,940 | 3.20% | -2.00% |
| 13 | Chicago, Illinois | $1,500 | 2.00% | -15.30% | $1,910 | -3.00% | -15.50% |
| 13 | Long Beach, CA | $1,500 | -4.50% | 11.10% | $2,100 | 5.00% | 11.10% |
| 15 | Philadelphie, Pennsylvanie | $1,470 | 5.00% | 6.50% | $1,640 | 5.10% | 3.10% |
| 16 | Atlanta, Géorgie | $1,430 | -2.10% | 7.50% | $1,840 | -1.60% | 9.50% |
| 17 | Denver, Colorado | $1,400 | -2.10% | 15.70% | $1,910 | 1.10% | 13.70% |
| 18 | Minneapolis, MN | $1,390 | 5.30% | 3.00% | $1,850 | 5.10% | 12.80% |
| 19 | Providence, RI | $1,380 | 3.80% | -0.70% | $1,440 | 5.10% | -2.70% |
| 20 | Portland, Oregon | $1,370 | 3.00% | 2.20% | $1,590 | 1.90% | -0.60% |
| 21 | New Orleans, LA | $1,360 | 4.60% | 0.00% | $1,410 | 5.20% | -6.60% |
| 22 | Baltimore, MD | $1,320 | 4.80% | 14.80% | $1,520 | 2.00% | 15.20% |
| 23 | Nashville, TN | $1,310 | 4.80% | 7.40% | $1,440 | 5.10% | 9.10% |
| 24 | Dallas, Texas | $1,300 | 1.60% | -1.50% | $1,760 | 3.50% | -1.70% |
| 25 | Houston, Texas | $1,290 | 2.40% | 12.20% | $1,630 | 5.20% | 14.00% |
| 25 | Scottsdale, AZ | $1,290 | -5.10% | 2.40% | $2,010 | -5.20% | -8.20% |
| 27 | Madison, WI | $1,200 | 5.30% | 4.30% | $1,360 | 4.60% | 7.90% |
| 28 | Orlando, Floride | $1,180 | -0.80% | 15.70% | $1,390 | 5.30% | 15.80% |
| 29 | Sacramento, CA | $1,170 | -3.30% | 9.30% | $1,400 | 2.90% | 11.10% |
| 30 | Austin, Texas | $1,160 | -1.70% | 10.50% | $1,450 | -1.40% | 9.00% |
| 31 | Charlotte, Caroline du Nord | $1,150 | -4.20% | 0.00% | $1,290 | 3.20% | 1.60% |
| 32 | Irving, TX | $1,140 | -5.00% | 6.50% | $1,540 | 4.10% | 12.40% |
| 32 | Tampa, Floride | $1,140 | -0.90% | 14.00% | $1,340 | 4.70% | 9.80% |
| 34 | Aurora, CO | $1,120 | 3.70% | 9.80% | $1,410 | 5.20% | 3.70% |
| 34 | Plano, TX | $1,120 | -0.90% | 5.70% | $1,500 | -0.70% | 4.90% |
| 36 | Virginia Beach, VA | $1,090 | 3.80% | 16.00% | $1,200 | 4.30% | 4.30% |
| 37 | Gilbert, AZ | $1,070 | -5.30% | 5.90% | $1,330 | -1.50% | 3.10% |
| 38 | Fort Worth, TX | $1,060 | 5.00% | 11.60% | $1,260 | 1.60% | 14.50% |
| 39 | Chandler, AZ | $1,050 | -5.40% | 10.50% | $1,250 | 0.80% | 8.70% |
| 39 | Newark, NJ | $1,050 | 0.00% | 14.10% | $1,250 | 0.00% | 6.80% |
| 39 | Pittsburgh, PA | $1,050 | 5.00% | 1.00% | $1,280 | 4.90% | -1.50% |
| 39 | Richmond, VA | $1,050 | 4.00% | 7.10% | $1,210 | 5.20% | 10.00% |
| 43 | Chesapeake, VA | $1,040 | 5.10% | 14.30% | $1,200 | 0.00% | 4.30% |
| 44 | Durham, NC | $1,030 | 5.10% | 10.80% | $1,170 | 5.40% | 13.60% |
| 44 | Henderson, NV | $1,030 | -4.60% | 6.20% | $1,200 | 4.30% | 7.10% |
| 46 | Salt Lake City, UT | $1,020 | 5.20% | 15.90% | $1,260 | 5.00% | 9.60% |
| 47 | Raleigh, NC | $1,010 | 4.10% | 0.00% | $1,170 | 1.70% | 1.70% |
| 48 | Buffalo, NY | $990 | 5.30% | 10.00% | $1,150 | 4.50% | -8.70% |
| 49 | St Petersburg, FL | $980 | 1.00% | 14.00% | $1,620 | 5.20% | 14.10% |
| 50 | Kansas City, MO | $960 | 3.20% | 4.30% | $1,040 | 5.10% | 11.80% |
| 51 | Phoenix, Arizona | $950 | -1.00% | 9.20% | $1,140 | 3.60% | 8.60% |
| 52 | Jacksonville, FL | $930 | -1.10% | 9.40% | $1,050 | 0.00% | -2.80% |
| 53 | Las Vegas, Nevada | $910 | 1.10% | 15.20% | $1,050 | 5.00% | 11.70% |
| 54 | Baton Rouge, LA | $900 | 4.70% | -1.10% | $940 | 4.40% | -1.10% |
| 54 | Fresno, CA | $900 | -3.20% | 5.90% | $1,050 | 5.00% | 10.50% |
| 56 | Mesa, AZ | $880 | -3.30% | 11.40% | $1,010 | 5.20% | 3.10% |
| 56 | Milwaukee, WI | $880 | 4.80% | 10.00% | $990 | 5.30% | 15.10% |
| 56 | San Antonio, TX | $880 | 1.10% | 6.00% | $1,140 | 3.60% | 5.60% |
| 59 | Boise, ID | $870 | 2.40% | 7.40% | $950 | 0.00% | 2.20% |
| 59 | Colorado Springs, CO | $870 | 4.80% | 10.10% | $1,050 | 5.00% | 0.00% |
| 59 | Louisville, KY | $870 | -1.10% | 8.70% | $950 | 2.20% | 13.10% |
| 62 | Anchorage, AK | $860 | -1.10% | -5.50% | $1,100 | -0.90% | -4.30% |
| 62 | Corpus Christi, TX | $860 | 1.20% | 8.90% | $1,070 | 0.90% | 11.50% |
| 64 | Syracuse, NY | $850 | -4.50% | 13.30% | $930 | -1.10% | -2.10% |
| 65 | Cincinnati, OH | $830 | 5.10% | 12.20% | $1,070 | 4.90% | 11.50% |
| 65 | Omaha, NE | $830 | 2.50% | 13.70% | $970 | 5.40% | 7.80% |
| 67 | Rochester, NY | $820 | 5.10% | 15.50% | $1,000 | 2.00% | 13.60% |
| 68 | Reno, NV | $800 | 0.00% | 14.30% | $1,170 | -0.80% | 15.80% |
| 69 | Laredo, TX | $790 | 5.30% | 8.20% | $940 | 4.40% | 9.30% |
| 70 | Arlington, TX | $770 | 5.50% | 10.00% | $1,020 | 5.20% | 10.90% |
| 70 | Chattanooga, TN | $770 | -1.30% | 10.00% | $810 | -1.20% | 12.50% |
| 70 | Knoxville, TN | $770 | 1.30% | 14.90% | $870 | 4.80% | 13.00% |
| 73 | Bakersfield, CA | $760 | -5.00% | 10.10% | $890 | 3.50% | 6.00% |
| 73 | Des Moines, IA | $760 | 5.60% | 1.30% | $800 | 5.30% | -1.20% |
| 75 | Glendale, AZ | $750 | -5.10% | 7.10% | $900 | 4.70% | 2.30% |
| 75 | Lexington, KY | $750 | -5.10% | -6.30% | $940 | 1.10% | 1.10% |
| 75 | St Louis, MO | $750 | 5.60% | 10.30% | $1,060 | 5.00% | 11.60% |
| 78 | Cleveland, OH | $730 | 2.80% | 15.90% | $800 | 5.30% | 14.30% |
| 78 | Norfolk, VA | $730 | 4.30% | 10.60% | $930 | 3.30% | 3.30% |
| 80 | Augusta, GA | $710 | 0.00% | 14.50% | $790 | 5.30% | -1.30% |
| 80 | Spokane, WA | $710 | 2.90% | 7.60% | $900 | -1.10% | 8.40% |
| 82 | Tallahassee, FL | $700 | -1.40% | 11.10% | $830 | 5.10% | 6.40% |
| 82 | Winston Salem, NC | $700 | 4.50% | 1.40% | $760 | 5.60% | 8.60% |
| 84 | Greensboro, NC | $680 | -1.40% | 13.30% | $810 | 1.30% | 5.20% |
| 84 | Indianapolis, IN | $680 | 3.00% | 15.30% | $760 | 5.60% | 11.80% |
| 84 | Oklahoma City, OK | $680 | -4.20% | 11.50% | $820 | 5.10% | 5.10% |
| 87 | Columbus, Ohio | $670 | 4.70% | 3.10% | $1,000 | 5.30% | 5.30% |
| 87 | Tucson, AZ | $670 | -5.60% | 11.70% | $820 | 2.50% | 2.50% |
| 89 | Memphis, TN | $660 | 4.80% | 13.80% | $720 | 4.30% | 14.30% |
| 90 | Albuquerque, NM | $630 | 1.60% | 5.00% | $800 | 0.00% | 5.30% |
| 90 | El Paso, TX | $630 | 0.00% | -1.60% | $770 | 4.10% | 0.00% |
| 92 | Lincoln, NE | $610 | 5.20% | -9.00% | $810 | 5.20% | 0.00% |
| 92 | Shreveport, LA | $610 | 5.20% | 5.20% | $650 | 4.80% | 1.60% |
| 94 | Tulsa, OK | $600 | -4.80% | 5.30% | $750 | 2.70% | 2.70% |
| 94 | Wichita, KS | $600 | 5.30% | 15.40% | $690 | 4.50% | 4.50% |
| 96 | Akron, OH | $590 | 5.40% | 11.30% | $700 | 4.50% | 4.50% |
| 96 | Lubbock, TX | $590 | 1.70% | 1.70% | $750 | 2.70% | 7.10% |
| 98 | Detroit, MI | $560 | 5.70% | 3.70% | $630 | 5.00% | -3.10% |
| 99 | Fort Wayne, IN | $540 | 5.90% | 12.50% | $610 | 5.20% | 10.90% |
| 100 | Toledo, OH | $530 | -5.40% | 15.20% | $640 | 0.00% | 14.30% |
About
The Zumper SF Bay Area Metro Report analyzed active listings that hit the market in January 2018. Listings are aggregated by city to calculate median asking rents.
In the market for a new place? Search all San Francisco apartments for rent on Zumper now.
Stay up to date with Zumper by following us on Facebook, Gazouillement, Instagram, & Pinterest.
Contenu associé