The Zumper SF Bay Area Metro Report analyzed active listings in November across 30 metro cities to show the most and least expensive cities and cities with the fastest growing rents. The California one bedroom median rent last month was $1,756.
Cities Ranked By Rent
The Most Expensive
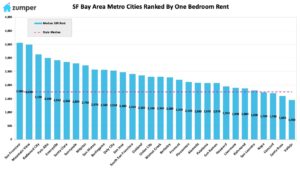
–San Francisco, Californie continued to rank as the most expensive city with one bedrooms priced at $3,560.
–Mountain View, CA was second with rent at $3,500.
–Redwood City, CA saw rent grow $20 to $3,130 but stay the third priciest city.
The Least Expensive
–Vallejo, CA rent grew $70 to $1,450 but remained the most affordable in the metro.
–Santa Rosa, CA ranked as the second least expensive city with rent at $1,600.
–Concord, CA fell down a spot to become the third most affordable with rent dropping $50 to $1,700.
Growth Rate
The Fastest Growing (Y/Y%)
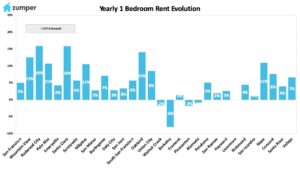
–Redwood City, CA & Santa Clara, CA tied for the city with the fastest growing rent, both with prices up 15.9% since this time last year.
–Oakland, CA was second with rent climbing 14.1%.
–Mountain View, CA rent had the third largest year over year growth rate, jumping 12.5%.
The Fastest Growing (M/M%)
–Santa Clara, CA rent grew 5.2% last month, making it the fastest growing.
–Petaluma & Vallejo, CA tied for second with rents both up 5.1%.
–Richmond, CA had the third fastest growing rent last month, increasing 5%.
Full Data
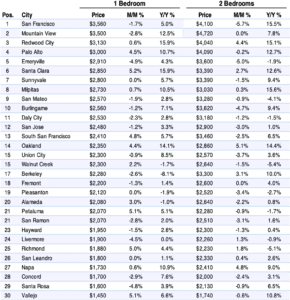
| 1 Bedroom | 2 Bedrooms | ||||||
|---|---|---|---|---|---|---|---|
| Pos. | City | Price | M/M % | Y/Y % | Price | M/M % | Y/Y % |
| 1 | San Francisco | $3,560 | -1.70% | 5.00% | $4,100 | -5.70% | 15.50% |
| 2 | Mountain View | $3,500 | -2.80% | 12.50% | $4,720 | 0.00% | 7.80% |
| 3 | Redwood City | $3,130 | 0.60% | 15.90% | $4,040 | 4.40% | 15.10% |
| 4 | Palo Alto | $3,000 | 4.50% | 10.70% | $4,090 | 0% | 13% |
| 5 | Emeryville | $2,910 | -4.90% | 4.30% | $3,600 | -5% | -2% |
| 6 | Santa Clara | $2,850 | 5.20% | 15.90% | $3,390 | 3% | 13% |
| 7 | Sunnyvale | $2,800 | 0.00% | 5.70% | $3,390 | -2% | 9% |
| 8 | Milpitas | $2,730 | 0.70% | 10.50% | $3,030 | 0% | 16% |
| 9 | San Mateo | $2,570 | -1.90% | 2.80% | $3,280 | -1% | -4% |
| 10 | Burlingame | $2,560 | -1.20% | 7.10% | $3,620 | -5% | 9% |
| 11 | Daly City | $2,530 | -2.30% | 2.80% | $3,180 | -1% | -2% |
| 12 | San Jose | $2,480 | -1.20% | 3.30% | $2,900 | -3% | 1% |
| 13 | South San Francisco | $2,410 | 4.80% | 5.70% | $3,460 | -3% | 7% |
| 14 | Oakland | $2,350 | 4.40% | 14.10% | $2,860 | 5% | 14% |
| 15 | Union City | $2,300 | -0.90% | 8.50% | $2,570 | -4% | 4% |
| 15 | Walnut Creek | $2,300 | 2.20% | -1.70% | $2,640 | -2% | -5% |
| 17 | Berkeley | $2,280 | -2.60% | -8.10% | $3,300 | 3% | 10% |
| 18 | Fremont | $2,200 | -1.30% | 1.40% | $2,600 | 0% | 4% |
| 19 | Pleasanton | $2,120 | 0.00% | -1.90% | $2,520 | -3% | -3% |
| 20 | Alameda | $2,080 | 3.00% | -1.00% | $2,640 | -2% | 1% |
| 21 | Petaluma | $2,070 | 5.10% | 5.10% | $2,280 | -1% | -2% |
| 21 | San Ramon | $2,070 | -2.80% | 2.00% | $2,510 | -3% | 2% |
| 23 | Hayward | $1,950 | -1.50% | 2.60% | $2,300 | -1% | 0% |
| 24 | Livermore | $1,900 | -4.50% | 0.00% | $2,260 | 1.30% | -0.90% |
| 25 | Richmond | $1,880 | 5.00% | 4.40% | $2,230 | 1.80% | -5.10% |
| 26 | San Leandro | $1,800 | 0.00% | 1.10% | $2,330 | 0.40% | 2.60% |
| 27 | Napa | $1,730 | 0.60% | 10.90% | $2,410 | 4.80% | 9.00% |
| 28 | Concord | $1,700 | -2.90% | 7.60% | $2,000 | -2.40% | 3.10% |
| 29 | Santa Rosa | $1,600 | -4.80% | 3.90% | $2,130 | -0.90% | 6.50% |
| 30 | Vallejo | $1,450 | 5.10% | 6.60% | $1,740 | -0.60% | 10.80% |
About
The Zumper SF Bay Area Metro Report analyzed active listings that hit the market last month. Listings are aggregated by city to calculate median asking rents.
In the market for a new place? Search all San Francisco apartments for rent on Zumper now.
Stay up to date with Zumper by following us on Facebook, Gazouillement, Instagram, & Pinterest.
Contenu associé