The Zumper SF Bay Area Metro Report analyzed active listings in March across 30 metro cities to show the most and least expensive cities and cities with the fastest growing rents. The California one bedroom median rent last month was $1,734.
Cities Ranked By Rent
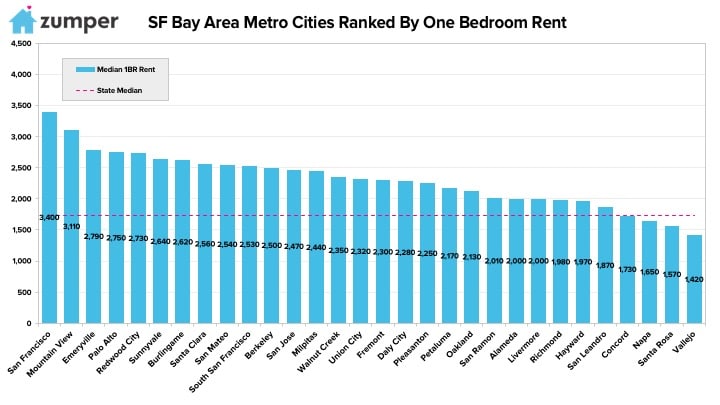
The Most Expensive
–San Francisco, Californie rent, similar to last month, remained at $3,400 and as the most expensive in the metro.
–Mountain View, CA was second with rent climbing $10 to $3,110.
–Emeryville, CA ranked as third with rent at $2,790.
The Least Expensive
–Vallejo, CA rent dropped $70 to $1,420 and continued to be the least expensive.
–Santa Rosa, CA was second with one bedrooms priced at $1,570.
–Napa, CA ranked as third with rent falling $50 to $1,650.
Growth Rate
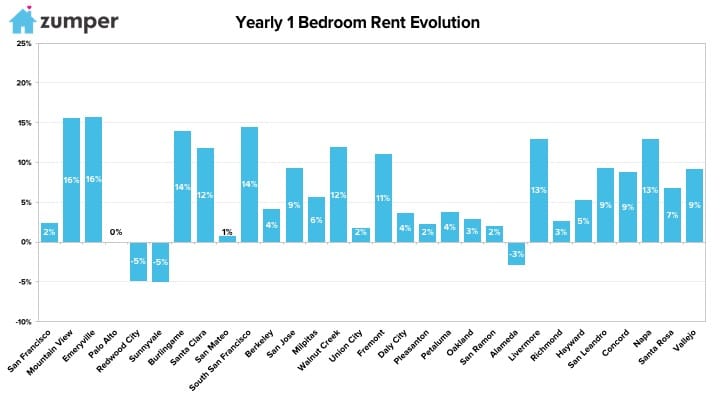
The Fastest Growing (Y/Y%)
–Emeryville, CA had the fastest growing rent since this time last year, up 15.8%.
–Mountain View, CA was close behind as second with rent climbing 15.6%.
–South San Francisco, CA ranked as third with rent jumping 14.5%.
The Fastest Growing (M/M%)
–Sunnyvale, CA rent was the fastest growing last month, increasing 5.2%.
–San Leandro, CA had the second largest monthly rental growth rate, up 5.1%.
–Redwood City & Union City, CA tied for third with rents both climbing 5%.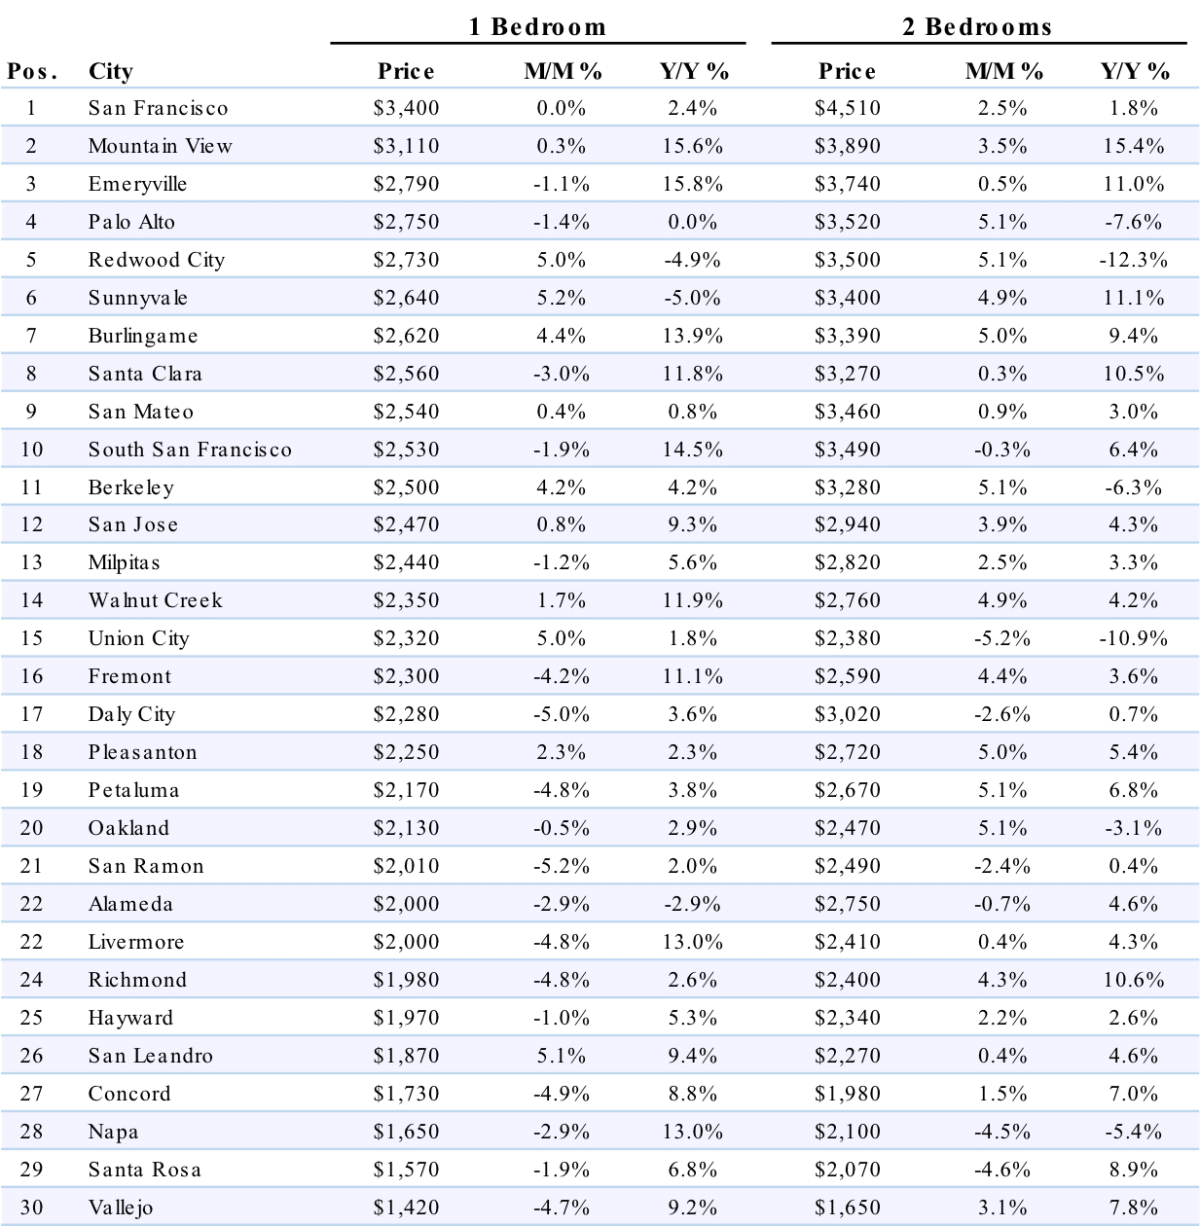
Full Data
| 1 Bedroom | 2 Bedrooms | ||||||
|---|---|---|---|---|---|---|---|
| 1 | Centennial | $1,520 | 1.30% | 12.60% | $2,010 | 5.20% | 14.20% |
| 2 | Denver | $1,470 | 2.10% | 15.70% | $1,980 | 1.00% | 15.80% |
| 3 | Lakewood | $1,460 | 2.80% | 13.20% | $1,550 | 4.00% | 7.60% |
| 4 | Broomfield | $1,450 | 0.70% | 1.40% | $1,780 | 0.00% | 2.90% |
| 5 | Westminster | $1,410 | 5.20% | 14.60% | $1,610 | 3.90% | 15.00% |
| 6 | Littleton | $1,400 | 5.30% | 15.70% | $1,700 | 0.00% | 3.70% |
| 7 | Castle Rock | $1,390 | 0.00% | 12.10% | $1,500 | -3.80% | 4.20% |
| 8 | Parker | $1,350 | 3.80% | -0.70% | $1,660 | 2.50% | 1.80% |
| 9 | Thornton | $1,220 | 4.30% | 15.10% | $1,440 | -2.00% | 14.30% |
| 10 | Arvada | $1,150 | -2.50% | 15.00% | $1,450 | 5.10% | 3.60% |
| 11 | Aurora | $1,110 | 0.00% | 11.00% | $1,450 | -0.70% | 6.60% |
| 12 | Northglenn | $1,090 | 0.00% | 0.90% | $1,370 | 1.50% | 0.70% |
About
The Zumper SF Bay Area Metro Report analyzed active listings that hit the market in March 2018. Listings are aggregated by city to calculate median asking rents.
In the market for a new place? Search all San Francisco apartments for rent on Zumper now.
Stay up to date with Zumper by following us on Facebook, Gazouillement, Instagram, & Pinterest.
Contenu associé