While San Francisco continued to reign as the most expensive city to rent throughout the past year, prices here showed a generally stagnant trend overall. As seen in the map below, a lot of neighborhoods were in the green with negative year over year rental growth rates. You can check out the full chart below for changes in every neighborhood.
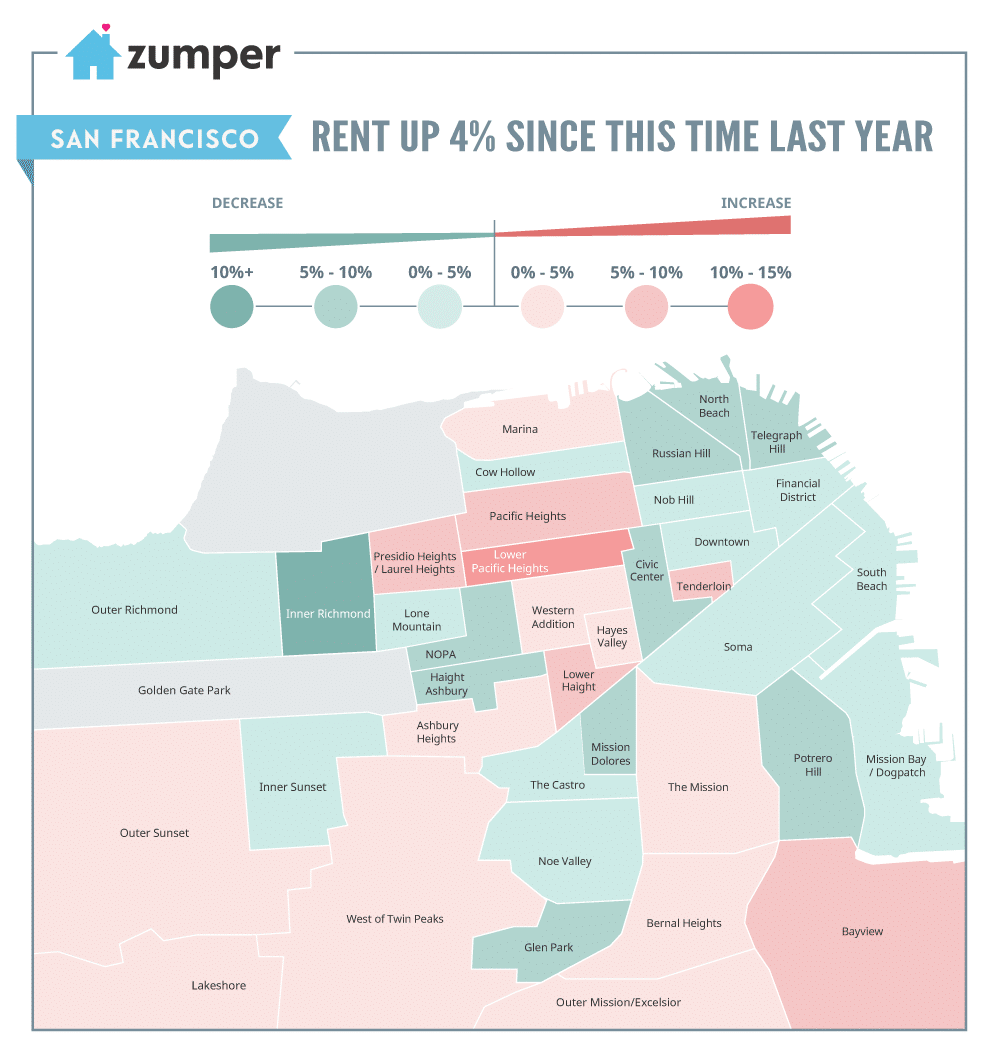
Overall, San Francisco neighborhoods close to downtown, and where a lot of the luxury housing stock is, saw a downward rental trend while the southernmost areas saw growth. The interest in cheaper neighborhoods, even if they are more on the edges of the city, seems to be spiking while the more expensive neighborhoods are falling short in that demand.
Lower Pacific Heights was the only neighborhood that had double digit rent growth, with prices up 10% since this time last year. Bayview (+8%), Tenderloin (+6%), and Lower Haight (+6%) were the areas that had the next largest spikes. On the other end of the spectrum, Cole Valley (-14%), Inner Richmond (-11%), and Mission Dolores (-9%) took the biggest rent dips.
If you’re interested in seeing how these changes compare to the rest of the nation’s, view our March National Rent Report, which analyzes over 1 million active listings available in the month prior to publication.
To keep up to date with rent changes across the country, like or follow Zumper on Facebook, Twitter, and Instagram. In the market for a new place? Search all San Francisco apartments for rent on Zumper now.
For a more in-depth look into why and how we calculate our rental data, check out our methodology post here.
Contenu associé