The Zumper San Francisco Bay Area Metro Report analyzed active listings in April 2019 across 30 metro cities to show the most and least expensive cities and cities with the fastest growing rents. The California one bedroom median rent last month was $1,765.
Cities Ranked By Rent
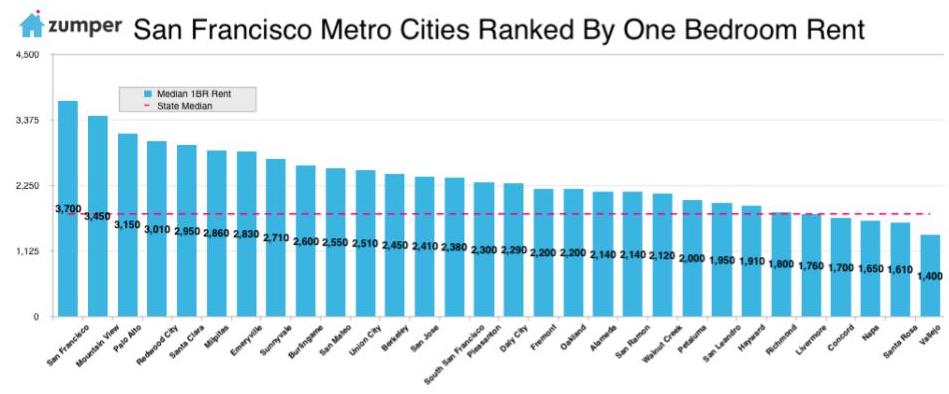
The Most Expensive
–San Francisco, Californie remained stable last month with one bedrooms holding steady at $3,700. This city remained the priciest city in both the metro and the nation.
–Mountain View, CA stayed as the second most expensive city with one bedrooms at $3,450.
–Palo Alto, CA saw rent drop $80 to $3,230 but continued to rank as third.
The Least Expensive
–Vallejo, CA rent increased $10 to $1,400 but remained the most affordable in the metro.
–Santa Rosa, CA rent dropped $80 and took over as the second most affordable city at $1,610.
–Napa, CA saw rent decrease $30 to $1,650 and moved into the number three spot.
Growth Rate
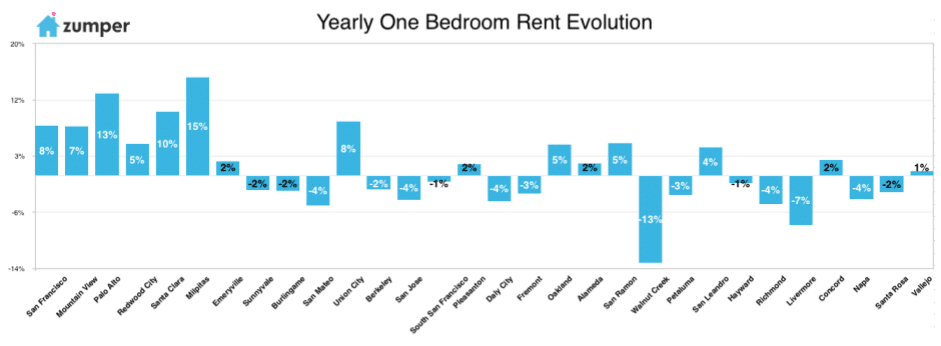
The Fastest Growing (Y/Y%)
–Milpitas, CA had the fastest growing rent, up 14.9% since this time last year.
–Palo Alto, CA saw rent climb 12.5%, making it the second fastest growing.
–Santa Clara, CA took third place, up 9.7% since this time last year.
The Fastest Growing (M/M%)
–San Ramon, CA rent had the largest monthly growth rate, up 3.9%.
–Union City, CA followed closely behind with rent jumping 3.7% since last month.
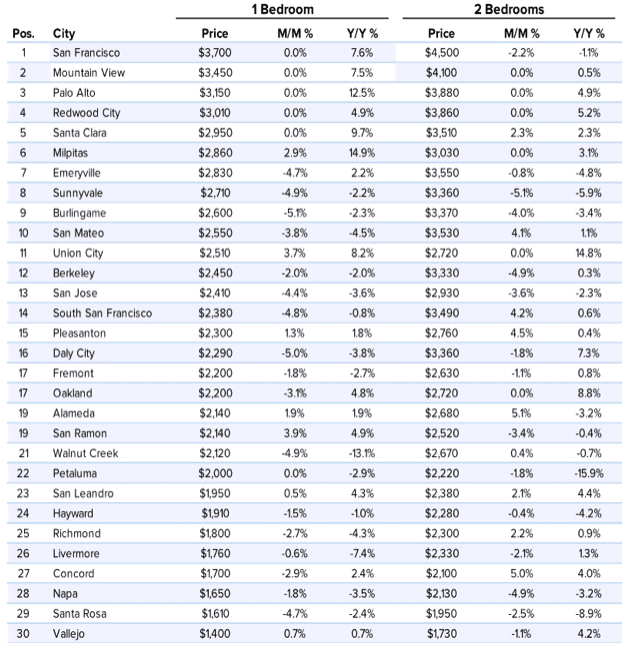
Full Data
| 1 Bedroom | 2 Bedrooms | ||||||
|---|---|---|---|---|---|---|---|
| Pos. | City | Price | M/M % | Y/Y % | Price | M/M % | Y/Y % |
| 1 | San Francisco | $3,700 | 0.0% | 7.6% | $4,500 | -2.2% | -1.1% |
| 2 | Mountain View | $3,450 | 0.0% | 7.5% | $4,100 | 0.0% | 0.5% |
| 3 | Palo Alto | $3,150 | 0.0% | 12.5% | $3,880 | 0.0% | 4.9% |
| 4 | Redwood City | $3,010 | 0.0% | 4.9% | $3,860 | 0.0% | 5.2% |
| 5 | Santa Clara | $2,950 | 0.0% | 9.7% | $3,510 | 2.3% | 2.3% |
| 6 | Milpitas | $2,860 | 2.9% | 14.9% | $3,030 | 0.0% | 3.1% |
| 7 | Emeryville | $2,830 | -4.7% | 2.2% | $3,550 | -0.8% | -4.8% |
| 8 | Sunnyvale | $2,710 | -4.9% | -2.2% | $3,360 | -5.1% | -5.9% |
| 9 | Burlingame | $2,600 | -5.1% | -2.3% | $3,370 | -4.0% | -3.4% |
| 10 | San Mateo | $2,550 | -3.8% | -4.5% | $3,530 | 4.1% | 1.1% |
| 11 | Union City | $2,510 | 3.7% | 8.2% | $2,720 | 0.0% | 14.8% |
| 12 | Berkeley | $2,450 | -2.0% | -2.0% | $3,330 | -4.9% | 0.3% |
| 13 | San Jose | $2,410 | -4.4% | -3.6% | $2,930 | -3.6% | -2.3% |
| 14 | South San Francisco | $2,380 | -4.8% | -0.8% | $3,490 | 4.2% | 0.6% |
| 15 | Pleasanton | $2,300 | 1.3% | 1.8% | $2,760 | 4.5% | 0.4% |
| 16 | Daly City | $2,290 | -5.0% | -3.8% | $3,360 | -1.8% | 7.3% |
| 17 | Fremont | $2,200 | -1.8% | -2.7% | $2,630 | -1.1% | 0.8% |
| 17 | Oakland | $2,200 | -3.1% | 4.8% | $2,720 | 0.0% | 8.8% |
| 19 | Alameda | $2,140 | 1.9% | 1.9% | $2,680 | 5.1% | -3.2% |
| 19 | San Ramon | $2,140 | 3.9% | 4.9% | $2,520 | -3.4% | -0.4% |
| 21 | Walnut Creek | $2,120 | -4.9% | -13.1% | $2,670 | 0.4% | -0.7% |
| 22 | Petaluma | $2,000 | 0.0% | -2.9% | $2,220 | -1.8% | -15.9% |
| 23 | San Leandro | $1,950 | 0.5% | 4.3% | $2,380 | 2.1% | 4.4% |
| 24 | Hayward | $1,910 | -1.5% | -1.0% | $2,280 | -0.4% | -4.2% |
| 25 | Richmond | $1,800 | -2.7% | -4.3% | $2,300 | 2.2% | 0.9% |
| 26 | Livermore | $1,760 | -0.6% | -7.4% | $2,330 | -2.1% | 1.3% |
| 27 | Concord | $1,700 | -2.9% | 2.4% | $2,100 | 5.0% | 4.0% |
| 28 | Napa | $1,650 | -1.8% | -3.5% | $2,130 | -4.9% | -3.2% |
| 29 | Santa Rosa | $1,610 | -4.7% | -2.4% | $1,950 | -2.5% | -8.9% |
| 30 | Vallejo | $1,400 | 0.7% | 0.7% | $1,730 | -1.1% | 4.2% |
Contenu associé