The Zumper SF Bay Area Metro Report analyzed active listings in June across 30 metro cities to show the most and least expensive cities and cities with the fastest growing rents.
Cities Ranked By Rent
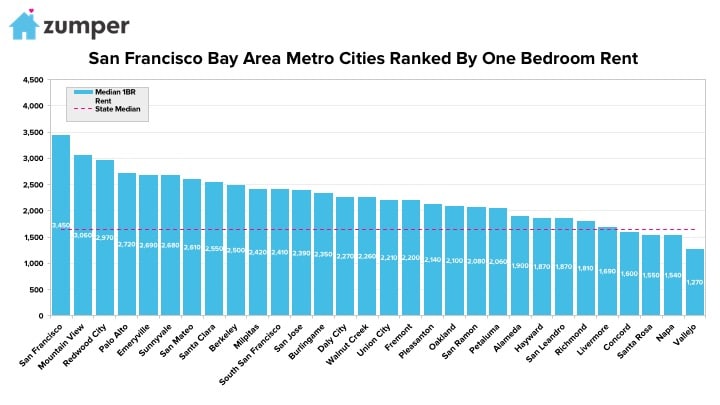
The Most Expensive
–San Francisco, Californie rent grew $80 since last month, now at $3,450, and continued to rank as the most expensive in the metro, and nationally.
–Mountain View, CA rent broke the $3,000 threshold, growing 5.2% to $3,060, and was the second priciest.
–Redwood City, CA ranked as third with rent at $2,970.
The Least Expensive
–Vallejo, CA rent grew $20 to $1,270 but remained the most affordable in the metro.
–Napa, CA ranked as the second least expensive city with rent at $1,540.
– Santa Rosa, CA followed closely behind as third with one bedrooms priced at $1,550.
Growth Rate
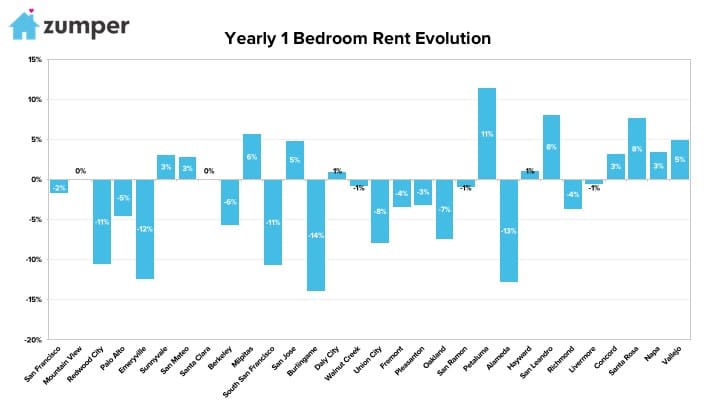
The Fastest Growing (Y/Y%)
–Petaluma, CA had the largest yearly growth rate for rent, up 11.4%.
–San Leandro, CA rent saw an 8.1% spike since this time last year, making it the second fastest growing.
–Santa Rosa, CA was third with rent up 7.6%.
The Fastest Growing (M/M%)
–Mountain View, CA had the fastest growing rent since last month, climbing 5.2%.
–Emeryville, Walnut Creek, & San Leandro, CA rents all tied for second fastest growing, up 5.1%.
–Santa Clara, CA ranked as third with rent up 4.9%,
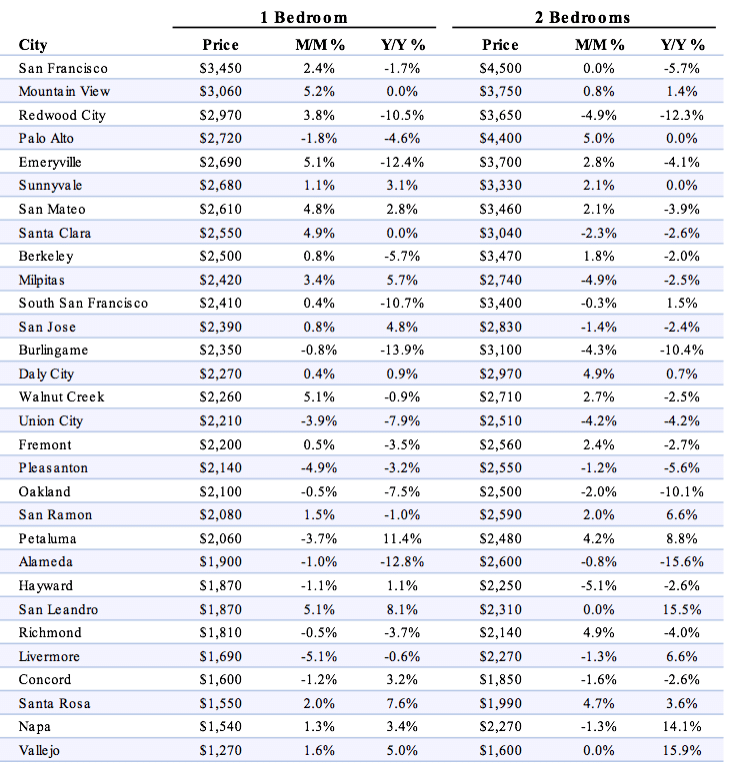
Full Data
| One Bedroom | Two Bedrooms | ||||||
|---|---|---|---|---|---|---|---|
| Pos. | City | Price | M/M % | Y/Y % | Price | M/M % | Y/Y % |
| 1 | Elkridge | $1,570 | -3.10% | 0.60% | $1,850 | 2.80% | 4.50% |
| 2 | Ellicott City | $1,490 | 2.10% | 0.70% | $1,640 | -1.80% | -2.40% |
| 3 | Columbia | $1,440 | 5.10% | 2.90% | $1,810 | 5.20% | 10.40% |
| 4 | Annapolis | $1,350 | -4.30% | -5.60% | $1,800 | 0.00% | -0.60% |
| 5 | Baltimore | $1,340 | 0.80% | 13.60% | $1,450 | -1.40% | 6.60% |
| 6 | Pikesville | $1,250 | 5.00% | 5.00% | $1,440 | -0.70% | -3.40% |
| 7 | Owings Mills | $1,240 | 4.20% | 5.10% | $1,500 | 1.40% | 7.10% |
| 8 | Towson | $1,220 | -2.40% | -10.90% | $1,450 | 0.70% | -12.70% |
| 9 | Glen Burnie | $1,180 | -1.70% | 15.70% | $1,390 | 2.20% | 3.00% |
| 10 | Catonsville | $1,050 | -4.50% | 6.10% | $1,340 | 3.10% | 11.70% |
| 11 | Parkville | $1,020 | 2.00% | 6.30% | $1,220 | 1.70% | 5.20% |
| 12 | Dundalk | $850 | 0.00% | 9.00% | $1,070 | 3.90% | -10.80% |
| 13 | Westminster | $830 | -3.50% | 0.00% | $1,100 | 0.90% | 1.90% |
| 14 | Brooklyn Park | $800 | 5.30% | -5.90% | $1,100 | 4.80% | 10.00% |
About
The Zumper SF Bay Area Metro Report analyzed active listings that hit the market in June 2017. Listings are aggregated by city to calculate median asking rents.
In the market for a new place? Search all San Francisco apartments for rent on Zumper now.
Stay up to date with Zumper by following us on Facebook, Gazouillement, Instagram, & Pinterest.
Contenu associé