Le rapport Zumper Portland Metro a analysé les annonces immobilières actives en mai dans 13 villes de la région métropolitaine afin d'établir le classement des villes les plus et les moins chères, ainsi que celles où les loyers ont connu la plus forte augmentation. Le loyer médian d'un appartement d'une chambre dans l'État s'élevait à 1 063 $ le mois dernier.
Classement des villes par loyer
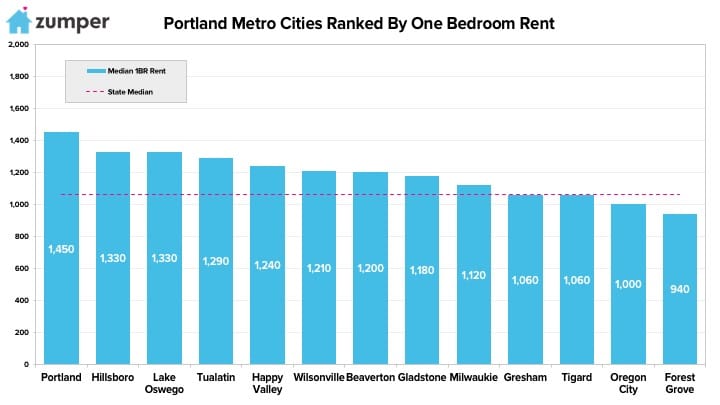
Le plus cher
–Portland, Oregon est restée la ville la plus chère avec un loyer de $1,450.
–Hillsboro & Lac Oswego, Oregon Les deux ont gagné une place pour se classer au deuxième rang des plus chers, avec un loyer de $1 330.
–Tualatin, Oregon Ils sont tombés à la troisième place avec des appartements d'une chambre au prix de $1 290.
Le moins cher
–Forest Grove, Oregon Elle a continué à se classer comme la plus abordable avec un loyer à $940.
–Oregon City, Oregon a vu le loyer baisser de $50, se stabilisant à $1 000, et perdre une place pour se classer au deuxième rang des plus abordables.
–Gresham & Tigard, Oregon ex aequo à la troisième place avec des prix de $1,060.
taux de croissance
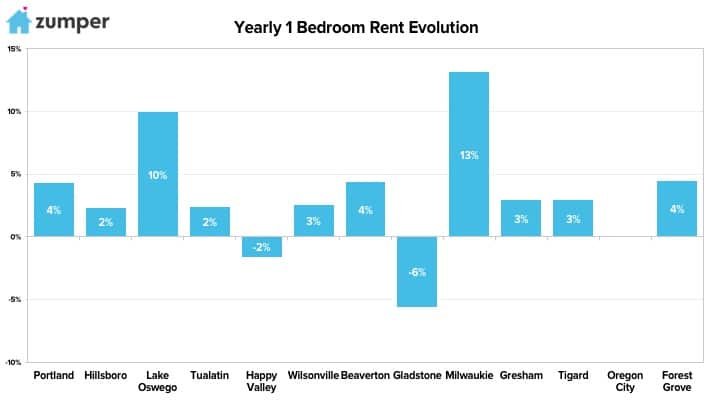
La croissance la plus rapide (Y/Y%)
–Milwaukie, Oregon Les loyers ont enregistré le taux de croissance annuel le plus élevé, en hausse de 13,11 TP3T.
–Lac Oswego, Oregon était deuxième avec un loyer en hausse de 9,9%.
La croissance la plus rapide (M/M%)
–Wilsonville, Oregon a enregistré la plus forte croissance des loyers le mois dernier, avec une hausse de 5,2%.
–Happy Valley, Oregon suivi de près en deuxième position avec une croissance des loyers de 5,1%.
–Hillsboro & Lac Oswego, Oregon ex aequo à la troisième place, les prix ayant grimpé de 4,7% le mois dernier. 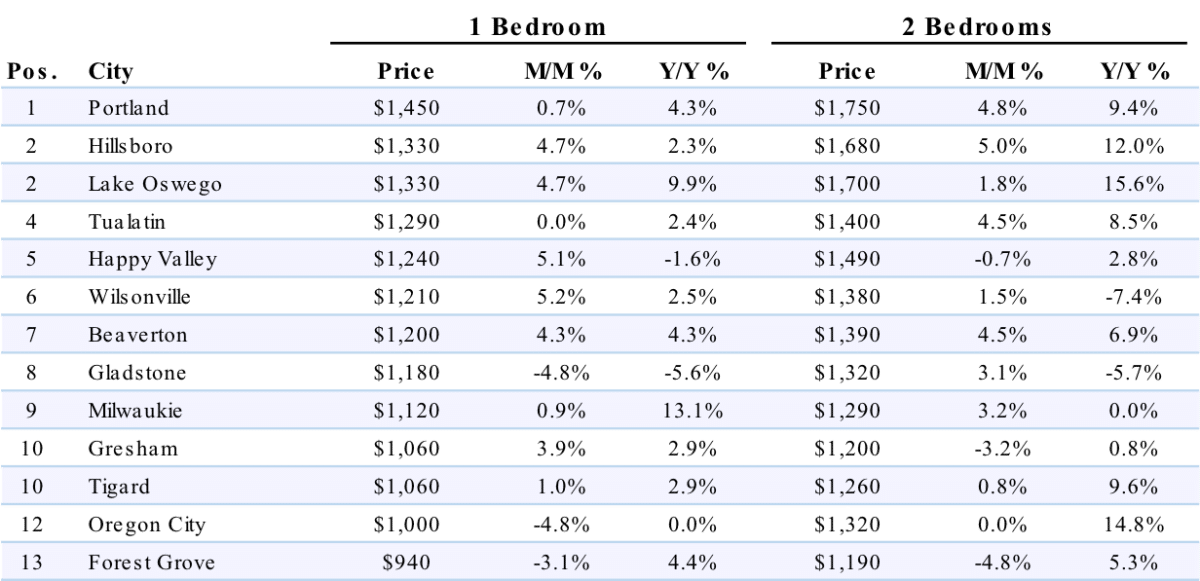
Données complètes
| 1 chambre | 2 chambres | ||||||
|---|---|---|---|---|---|---|---|
| Pos. | Ville | Prix | M/M % | Y/Y % | Prix | M/M % | Y/Y % |
| 1 | Vue sur la montagne | $3,540 | 5.00% | 15.70% | $4,320 | 0.90% | 15.20% |
| 2 | San Francisco | $3,500 | 0.30% | 1.40% | $4,680 | 1.70% | 4.00% |
| 3 | Ville de Redwood | $3,160 | 5.00% | 6.40% | $4,040 | 4.90% | 10.70% |
| 4 | Sunnyvale | $3,060 | 5.20% | 14.20% | $3,850 | 4.10% | 15.60% |
| 5 | Emeryville | $3,000 | 3.10% | 11.50% | $3,830 | 1.60% | 3.50% |
| 6 | Santa Clara | $2,950 | 5.00% | 15.70% | $3,510 | -2.50% | 15.50% |
| 7 | Palo Alto | $2,820 | 0.00% | 3.70% | $3,700 | -0.80% | -15.90% |
| 8 | Milpitas | $2,740 | 5.00% | 13.20% | $3,120 | 1.00% | 13.90% |
| 9 | San Mateo | $2,660 | -0.70% | 1.90% | $3,690 | 1.70% | 6.60% |
| 10 | Sud de San Francisco | $2,650 | 5.20% | 10.00% | $3,480 | 3.90% | 2.40% |
| 11 | Daly City | $2,570 | 3.20% | 13.20% | $3,250 | 0.60% | 9.40% |
| 12 | Union City | $2,560 | 4.90% | 15.80% | $2,610 | 4.80% | 4.00% |
| 13 | Berkeley | $2,500 | -0.80% | 0.00% | $3,470 | -0.60% | 0.00% |
| 14 | San José | $2,480 | -2.00% | 3.80% | $3,010 | -0.30% | 6.40% |
| 15 | Burlingame | $2,400 | -5.10% | 2.10% | $3,590 | 4.70% | 15.80% |
| 16 | Walnut Creek | $2,320 | -1.30% | 2.70% | $2,590 | 0.00% | -4.40% |
| 17 | Fremont | $2,300 | 0.90% | 4.50% | $2,620 | -0.80% | 2.30% |
| 18 | Pleasanton | $2,200 | -2.20% | 2.80% | $2,670 | -3.60% | 4.70% |
| 19 | Alameda | $2,180 | 4.80% | 14.70% | $2,660 | -1.50% | 2.30% |
| 20 | San Ramon | $2,120 | 1.00% | 1.90% | $2,620 | 4.80% | 1.20% |
| 21 | Oakland | $2,100 | -3.20% | 0.00% | $2,480 | -0.80% | -0.80% |
| 22 | Hayward | $1,960 | -0.50% | 4.80% | $2,400 | 0.00% | 6.70% |
| 23 | San Leandro | $1,900 | 1.60% | 1.60% | $2,340 | 1.30% | 1.30% |
| 24 | Petaluma | $1,870 | -4.60% | -9.20% | $2,520 | -3.10% | 1.60% |
| 25 | Livermore | $1,790 | -1.60% | 5.90% | $2,270 | -1.70% | 0.00% |
| 25 | Richmond | $1,790 | 0.00% | -1.10% | $2,170 | 0.00% | 1.40% |
| 27 | Napa | $1,760 | 4.80% | 14.30% | $2,000 | -4.30% | -11.90% |
| 28 | Concorde | $1,700 | 3.00% | 6.30% | $2,020 | -1.50% | 9.20% |
| 29 | Santa Rosa | $1,560 | -0.60% | 0.60% | $2,160 | 3.30% | 8.50% |
| 30 | Vallejo | $1,350 | 0.00% | 6.30% | $1,610 | -0.60% | 0.60% |
À propos
Le rapport Zumper Portland Metro a analysé les biens immobiliers récemment mis sur le marché le mois dernier. Les annonces sont regroupées par ville afin de calculer le loyer médian demandé.
Vous cherchez un nouveau logement ? Consultez toutes les annonces. Appartements à louer à Portland Disponible dès maintenant sur Zumper.
Restez informé des actualités de Zumper en nous suivant sur Facebook, Gazouillement, Instagram, & Pinterest.
Contenu associé


