2018 Wrap Up & 2019 Rental Thoughts
2018 saw a plateauing of prices in the most expensive markets as the year is ending with the top 10 cities remaining relatively unchanged since January. Smaller markets have been playing catch up with bigger markets all of 2018, with many mid and lower tiered cities experiencing consistent double digit rent growth every month. All of the markets with the largest year to date changes below were mid and lower-tiered markets ranging from 48th – 93rd.
Rents in 2019 will most likely see accelerated growth due to pressure from a continued slow for-sale market, with continued interest rates hikes on the horizon, millennials favoring a sharing economy, so owning things, from cars to houses, is becoming less of a priority than it has been before, and an overall lack of available supply to meet a growing demand (U.S. rental vacancy is at 6.8%, which is the lowest it’s been since early 1990’s [Census].)
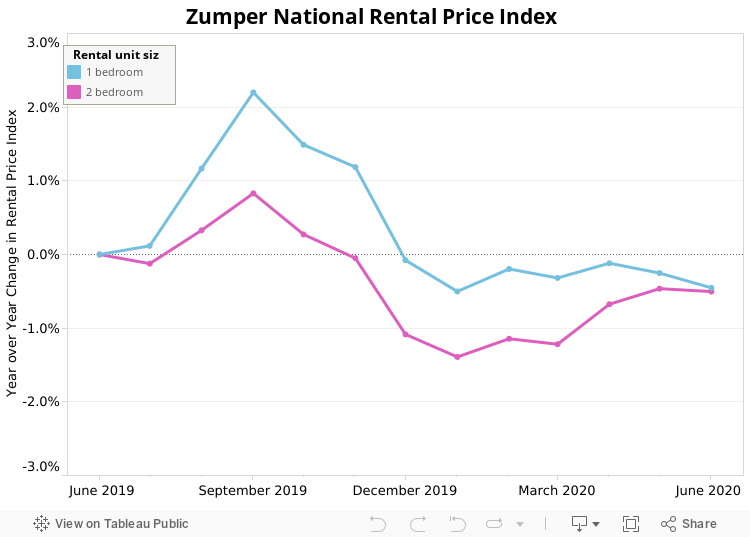
Nationally, one bedroom rent grew 0.8% to $1,212 last month, while two bedrooms increased 0.5% to $1,430. On a year to date basis, one bedroom rent is down 1.9% and two bedroom rent is up and 3.9%.
Les cinq principaux marchés locatifs
1. San Francisco, Californie saw one bedroom rent fall 1.7% to $3,560, while two bedrooms remained flat at $4,720.
2. New York, NY one bedroom rent dropped 3.5% to $2,750, while two bedrooms decreased 1.5% to $3,190.
3. Boston, Massachusetts moved up 2 spots to become 3rd with one bedroom rent growing 3.3% to $2,480 while two bedrooms stayed stable at $2,700.
3. San José, Californie tied with Boston for 3rd with one bedroom rent decreasing 1.2% to $2,480 and two bedrooms dropping 3% to $2,900.
5. Los Angeles, Californie fell 1 spot to rank as the 5th most expensive city. One bedroom rent decreased 0.8% to $2,410, while two bedrooms increased 0.6% to $3,240.
Changements notables ce mois-ci
 Vers le haut
–Nouvelle-Orléans, Louisiane moved up 3 spots to become the 22nd most expensive city. One bedroom rent jumped 5.3% to $1,380, while two bedrooms remained flat at $1,450.
–Scottsdale, Arizona also rose 3 positions to rank as 22nd. One bedroom rent grew 5.3% to $1,380, while two bedrooms increased 1.5% to $1,990.
–Las Vegas, Nevada one bedrooms had the largest monthly growth rate in the nation, up 5.4% to $970. Two bedrooms saw more modest growth, up 1.8% to $1,140.
–Knoxville, Tennessee saw one bedroom rent climb 5.1%, settling at $820, and up 2 spots to become the 72nd most expensive in the nation.
–Saint-Louis, Missouri jumped 4 positions to rank as 75th with one bedroom rent growing 5.3% to $800, while two bedrooms increased 4.7% to $1,110.
 Vers le bas
–Madison, Wisconsin one bedroom rent took the largest monthly dip in the nation, down 4.7% to $1,220. Two bedrooms saw a more modest decline, down 0.7% to $1,490.
–Plano, Texas took a 6 ranking plunge to 41st. One bedroom rent fell 3.5% to $1,110, while two bedrooms decreased 2% to $1,500.
–Chesapeake, Virginie saw one bedroom rent fall 3.9% to $990 and take a 4 ranking dip to 52nd.
–Louisville, Kentucky dropped 4 spots to become the 67th priciest market. One bedroom rent fell 4.5% to $840, while two bedrooms decreased 2% to $1,000.
–Laredo, Texas one bedroom rent moved dropped 4.6%, settling at $830, and down 6 spots to become 70th. Two bedroom rent was down 3.1% to $950.
Notable Changes Year to Date
Cities with The Most Rent Growth
–Columbus, Ohio: +23%
–Des Moines, Iowa: +21%
–Saint-Louis, Missouri: +17.6%
–Memphis, Tennessee: +17.2%
–Shreveport, Louisiane: +16.1%
Cities with The Largest Rent Dips
–Tucson, Arizona: -9.9%
–Bakersfield, Californie: -7.9%
–Louisville, Kentucky: -7.7%
–Syracuse, New York: -7.4%
–Virginia Beach, Virginie: -7.2%
Largest Position Changes Year to Date
Up The Most Positions
–Des Moines, Iowa: +11 spots
–Aurora, Colorado, Norfolk, Virginie, Columbus, Ohio: +8 spots
–Orlando, Floride & Las Vegas, Nevada: +7 spots
Down the most positions
–Lincoln, NE: -20 spots
–Tucson, Arizona: -18 spots
–Baton Rouge, Louisiane & Syracuse, New York: -15 spots


Données complètes
| 1 chambre | 2 chambres | ||||||||
|---|---|---|---|---|---|---|---|---|---|
| Pos. | Ville | Prix | M/M % | Y/Y % | YTD% | Prix | M/M % | Y/Y % | YTD% |
| 1 | San Francisco, Californie | $3,560 | -1.70% | 5.00% | 4.70% | $4,720 | 0.00% | 7.80% | 7.30% |
| 2 | New York, NY | $2,750 | -3.50% | -5.20% | -4.20% | $3,190 | -1.50% | -5.10% | -2.70% |
| 3 | Boston, Massachusetts | $2,480 | 3.30% | 10.20% | 7.80% | $2,700 | 0.00% | 0.40% | 0.00% |
| 3 | San José, Californie | $2,480 | -1.20% | 3.30% | 0.80% | $2,900 | -3.00% | 1.00% | 4.30% |
| 5 | Los Angeles, Californie | $2,410 | -0.80% | 9.50% | 8.60% | $3,240 | 0.60% | 1.90% | 1.30% |
| 6 | Oakland, Californie | $2,350 | 4.40% | 14.10% | 11.90% | $2,860 | 5.10% | 14.40% | 15.80% |
| 7 | Washington, D.C. | $2,130 | -1.80% | -8.60% | -6.60% | $2,650 | -2.20% | -13.40% | -10.20% |
| 8 | San Diego, Californie | $1,910 | 1.10% | 13.00% | 11.70% | $2,500 | -0.80% | 13.10% | 11.10% |
| 9 | Seattle, WA | $1,900 | 1.60% | 3.30% | 3.80% | $2,510 | 0.00% | 4.10% | 4.60% |
| 10 | Santa Ana, Californie | $1,880 | -0.50% | 3.90% | #N/A | $2,260 | 1.80% | 15.90% | #N/A |
| 11 | Honolulu, Hawaï | $1,780 | 4.70% | 4.70% | 7.90% | $2,200 | 0.00% | 4.30% | 0.00% |
| 12 | Miami, Floride | $1,760 | -2.20% | 0.60% | -0.60% | $2,400 | 0.00% | 0.00% | -2.00% |
| 13 | Anaheim, Californie | $1,660 | -1.80% | -0.60% | #N/A | $2,190 | 2.30% | 4.30% | #N/A |
| 14 | Long Beach, Californie | $1,600 | 3.20% | 11.90% | 6.70% | $2,000 | 1.50% | 5.30% | 3.60% |
| 15 | Fort Lauderdale, Floride | $1,570 | 4.70% | 4.70% | 8.30% | $2,060 | 3.00% | 8.40% | 12.00% |
| 16 | Philadelphie, Pennsylvanie | $1,520 | -0.70% | 7.80% | 8.60% | $1,700 | 1.20% | 6.30% | 13.30% |
| 17 | Chicago, Illinois | $1,510 | 0.70% | -1.30% | -2.60% | $1,840 | -0.50% | -15.60% | -11.10% |
| 17 | Denver, Colorado | $1,510 | 0.00% | 7.10% | 8.60% | $1,930 | -0.50% | 6.60% | 6.00% |
| 17 | Providence, Rhode Island | $1,510 | 2.00% | 11.00% | 7.90% | $1,560 | -4.90% | 2.00% | 8.30% |
| 20 | Atlanta, Géorgie | $1,480 | 0.00% | 8.00% | 3.50% | $1,800 | -0.60% | 2.90% | -2.70% |
| 21 | Minneapolis, Minnesota | $1,400 | 0.00% | 15.70% | 6.10% | $1,910 | -2.10% | 11.00% | 8.50% |
| 22 | Nouvelle-Orléans, Louisiane | $1,380 | 5.30% | 0.00% | 11.30% | $1,450 | 0.00% | -0.70% | 2.80% |
| 22 | Scottsdale, Arizona | $1,380 | 5.30% | 4.50% | 3.00% | $1,990 | 1.50% | -5.20% | -7.90% |
| 24 | Baltimore, Maryland | $1,350 | 2.30% | 14.40% | 7.10% | $1,550 | -1.30% | 10.70% | 5.40% |
| 24 | Portland, Oregon | $1,350 | 0.00% | 1.50% | 1.50% | $1,660 | 1.20% | 7.80% | 3.80% |
| 26 | Nashville, Tennessee | $1,330 | 0.00% | 8.10% | 3.10% | $1,390 | -0.70% | 6.90% | -0.70% |
| 27 | Orlando, Floride | $1,300 | 1.60% | 13.00% | 15.00% | $1,490 | 0.70% | 14.60% | 14.60% |
| 27 | Sacramento, Californie | $1,300 | 0.00% | 13.00% | 9.20% | $1,450 | 0.00% | 7.40% | 8.20% |
| 29 | Dallas, Texas | $1,260 | 0.00% | -4.50% | -3.10% | $1,690 | 0.00% | -2.90% | -1.20% |
| 30 | Houston, Texas | $1,220 | 1.70% | -3.20% | 1.70% | $1,490 | 0.00% | -4.50% | 0.70% |
| 30 | Madison, Wisconsin | $1,220 | -4.70% | 0.80% | 1.70% | $1,490 | -0.70% | 14.60% | 12.90% |
| 32 | Austin, Texas | $1,200 | -0.80% | 4.30% | 4.30% | $1,500 | -1.30% | 5.60% | 3.40% |
| 33 | Aurora, Colorado | $1,170 | 1.70% | 11.40% | 13.60% | $1,410 | 0.70% | 6.80% | 6.80% |
| 34 | Chandler, Arizona | $1,160 | 3.60% | 10.50% | 9.40% | $1,360 | 3.00% | 12.40% | 13.30% |
| 35 | Newark, NJ | $1,150 | 2.70% | 15.00% | 10.60% | $1,360 | -0.70% | 13.30% | 13.30% |
| 35 | Pittsburgh, Pennsylvanie | $1,150 | -1.70% | -1.70% | 9.50% | $1,300 | -5.10% | -2.30% | 4.00% |
| 37 | Charlotte, Caroline du Nord | $1,140 | -1.70% | -2.60% | -5.00% | $1,300 | 0.00% | 4.00% | 4.80% |
| 38 | Gilbert, Arizona | $1,130 | 3.70% | 2.70% | -0.90% | $1,350 | -1.50% | -0.70% | 0.70% |
| 38 | Irving, Texas | $1,130 | 1.80% | 0.90% | -2.60% | $1,440 | 3.60% | 1.40% | 2.10% |
| 38 | Tampa, Floride | $1,130 | -1.70% | 2.70% | 2.70% | $1,330 | -1.50% | 1.50% | 3.10% |
| 41 | Durham, Caroline du Nord | $1,110 | -2.60% | 15.60% | 12.10% | $1,230 | 0.00% | 11.80% | 9.80% |
| 41 | Plano, Texas | $1,110 | -3.50% | -3.50% | -3.50% | $1,500 | -2.00% | 0.70% | 0.00% |
| 43 | Saint-Pétersbourg, Floride | $1,090 | 4.80% | 16.00% | 11.20% | $1,540 | 4.80% | 15.80% | 4.80% |
| 44 | Richmond, Virginie | $1,070 | 0.00% | 2.90% | 4.90% | $1,280 | 2.40% | 13.30% | 10.30% |
| 44 | Salt Lake City, Utah | $1,070 | 3.90% | 15.10% | 12.60% | $1,430 | -1.40% | 15.30% | 16.30% |
| 46 | Henderson, Nevada | $1,060 | 0.00% | 7.10% | -2.80% | $1,260 | 0.00% | 14.50% | 5.90% |
| 47 | Fort Worth, Texas | $1,050 | 1.00% | 6.10% | 6.10% | $1,250 | -1.60% | 1.60% | 3.30% |
| 48 | Virginia Beach, Virginie | $1,030 | 1.00% | 0.00% | -7.20% | $1,210 | 0.80% | 0.80% | 0.80% |
| 49 | Buffalo, New York | $1,020 | -2.90% | 15.90% | 13.30% | $1,240 | -3.10% | 15.90% | 18.10% |
| 50 | Fresno, Californie | $1,000 | 4.20% | 14.90% | 12.40% | $1,150 | 3.60% | 15.00% | 15.00% |
| 50 | Jacksonville, Floride | $1,000 | -1.00% | 6.40% | 1.00% | $1,050 | -4.50% | 0.00% | 0.00% |
| 52 | Chesapeake, Virginie | $990 | -3.90% | 15.10% | 5.30% | $1,200 | 0.00% | 1.70% | 0.00% |
| 53 | Raleigh, Caroline du Nord | $980 | -2.00% | 0.00% | 1.00% | $1,150 | -1.70% | 4.50% | 0.00% |
| 54 | Las Vegas, Nevada | $970 | 5.40% | 15.50% | 9.00% | $1,140 | 1.80% | 14.00% | 14.00% |
| 54 | Milwaukee, Wisconsin | $970 | -2.00% | 15.50% | 14.10% | $1,060 | -0.90% | 15.20% | 17.80% |
| 56 | Boise, Idaho | $960 | 0.00% | 15.70% | 10.30% | $1,040 | 0.00% | 11.80% | 9.50% |
| 57 | Kansas City, Missouri | $950 | 2.20% | 9.20% | 5.60% | $1,090 | 1.90% | 9.00% | 11.20% |
| 57 | Phoenix, Arizona | $950 | 0.00% | 6.70% | 2.20% | $1,190 | -0.80% | 10.20% | 8.20% |
| 59 | Reno, Nevada | $930 | 4.50% | 13.40% | 10.70% | $1,310 | 4.00% | 15.90% | 9.20% |
| 60 | Colorado Springs, Colorado | $910 | 0.00% | 8.30% | 8.30% | $1,140 | 4.60% | 8.60% | 11.80% |
| 61 | Anchorage, Alaska | $900 | 0.00% | -4.30% | 0.00% | $1,110 | -3.50% | -3.50% | 0.90% |
| 62 | Corpus Christi, Texas | $890 | -1.10% | -1.10% | 2.30% | $1,100 | 1.90% | 10.00% | 1.90% |
| 63 | San Antonio, Texas | $880 | 1.10% | 3.50% | 3.50% | $1,110 | 0.90% | 4.70% | 2.80% |
| 64 | Syracuse, New York | $870 | 4.80% | -6.50% | -7.40% | $910 | -5.20% | -7.10% | -8.10% |
| 65 | Des Moines, Iowa | $860 | 4.90% | 14.70% | 21.10% | $880 | -5.40% | 10.00% | 17.30% |
| 65 | Mesa, Arizona | $860 | 0.00% | 2.40% | -1.10% | $1,020 | -1.00% | 8.50% | 8.50% |
| 67 | Baton Rouge, Louisiane | $840 | 1.20% | -1.20% | 2.40% | $980 | 5.40% | 10.10% | 8.90% |
| 67 | Louisville, Kentucky | $840 | -4.50% | -9.70% | -7.70% | $1,000 | -2.00% | 2.00% | 4.20% |
| 67 | Rochester, New York | $840 | 2.40% | 15.10% | 9.10% | $980 | 0.00% | 15.30% | 5.40% |
| 70 | Laredo, Texas | $830 | -4.60% | 15.30% | 9.20% | $950 | -3.10% | 5.60% | 5.60% |
| 70 | Omaha, NE | $830 | 3.80% | 5.10% | -1.20% | $1,070 | 2.90% | 15.10% | 17.60% |
| 72 | Arlington, Texas | $820 | 2.50% | 15.50% | 13.90% | $1,090 | 1.90% | 16.00% | 13.50% |
| 72 | Knoxville, Tennessee | $820 | 5.10% | 15.50% | 9.30% | $900 | -1.10% | 15.40% | 8.40% |
| 74 | Cleveland, Ohio | $810 | -1.20% | 15.70% | 14.10% | $870 | 0.00% | 16.00% | 16.00% |
| 75 | Norfolk, Virginie | $800 | 2.60% | 15.90% | 14.30% | $950 | 2.20% | 11.80% | 5.60% |
| 75 | Saint-Louis, Missouri | $800 | 5.30% | 15.90% | 17.60% | $1,110 | 4.70% | 14.40% | 11.00% |
| 77 | Glendale, Arizona | $790 | 3.90% | 12.90% | 2.60% | $990 | 5.30% | 11.20% | 15.10% |
| 78 | Chattanooga, Tennessee | $780 | 0.00% | 6.80% | 2.60% | $890 | 0.00% | 15.60% | 11.30% |
| 78 | Cincinnati, Ohio | $780 | 0.00% | 14.70% | 4.00% | $1,120 | 0.00% | 15.50% | 15.50% |
| 78 | Winston-Salem, Caroline du Nord | $780 | 1.30% | 14.70% | 9.90% | $840 | 0.00% | 15.10% | 10.50% |
| 81 | Spokane, Washington | $760 | 1.30% | 4.10% | 8.60% | $960 | 2.10% | 12.90% | 10.30% |
| 82 | Columbus, Ohio | $750 | 2.70% | 15.40% | 23.00% | $1,070 | 0.00% | 11.50% | 12.60% |
| 82 | Lexington, Kentucky | $750 | 0.00% | 0.00% | 0.00% | $930 | -2.10% | 1.10% | 0.00% |
| 82 | Memphis, Tennessee | $750 | 0.00% | 15.40% | 17.20% | $790 | -1.30% | 12.90% | 14.50% |
| 85 | Augusta, Géorgie | $740 | 4.20% | 13.80% | 8.80% | $800 | -1.20% | 9.60% | 1.30% |
| 85 | Tallahassee, Floride | $740 | 1.40% | 13.80% | 8.80% | $880 | 1.10% | 15.80% | 10.00% |
| 87 | Oklahoma City, Oklahoma | $730 | 2.80% | 7.40% | 5.80% | $860 | 0.00% | 13.20% | 14.70% |
| 88 | Indianapolis, Indiana | $720 | 4.30% | 14.30% | 10.80% | $810 | -2.40% | 15.70% | 11.00% |
| 89 | Bakersfield, Californie | $700 | -1.40% | -2.80% | -7.90% | $900 | 0.00% | 5.90% | 3.40% |
| 89 | Greensboro, Caroline du Nord | $700 | -1.40% | 6.10% | 2.90% | $820 | 0.00% | 5.10% | 3.80% |
| 89 | Lincoln, NE | $700 | 1.40% | 14.80% | 14.80% | $940 | -3.10% | 14.60% | 16.00% |
| 92 | Albuquerque, Nouveau-Mexique | $670 | 1.50% | 6.30% | 11.70% | $840 | 1.20% | 5.00% | 5.00% |
| 93 | Shreveport, Louisiane | $650 | 3.20% | 12.10% | 16.10% | $730 | 4.30% | 14.10% | 14.10% |
| 94 | Tucson, Arizona | $640 | 0.00% | -3.00% | -9.90% | $830 | 1.20% | 3.80% | -1.20% |
| 95 | El Paso, Texas | $630 | -1.60% | 0.00% | 0.00% | $770 | 0.00% | 2.70% | 4.10% |
| 95 | Lubbock, Texas | $630 | 0.00% | 14.50% | 14.50% | $760 | -1.30% | 8.60% | 8.60% |
| 97 | Tulsa, Oklahoma | $620 | -1.60% | 0.00% | 3.30% | $780 | 0.00% | 6.80% | 5.40% |
| 98 | Wichita, Kansas | $610 | 1.70% | 15.10% | 10.90% | $750 | -1.30% | 11.90% | 11.90% |
| 99 | Détroit, Michigan | $600 | 3.40% | 3.40% | 11.10% | $700 | 2.90% | 7.70% | 11.10% |
| 100 | Akron, Ohio | $550 | 0.00% | 1.90% | 3.80% | $730 | 4.30% | 7.40% | 10.60% |
À propos
Le rapport national Zumper sur les loyers analyse les données locatives de plus d'un million d'annonces actives aux États-Unis. Les données sont agrégées mensuellement afin de calculer le loyer médian demandé pour les 100 principales agglomérations (par population), offrant ainsi une vision complète de l'état actuel du marché. Ce rapport s'appuie sur toutes les données disponibles au cours du mois précédant sa publication.
Si vous souhaitez une explication plus détaillée de la façon dont nous calculons nos données de loyer et des raisons de ce calcul, consultez notre méthodologie post.
Pour rester informé(e) des variations de loyer dans tout le pays, aimez ou suivez Zumper sur Facebook, Gazouillement, et Instagram. Vous cherchez un nouveau logement ? Rechercher appartements à louer sur Zumper.
Contenu associé