
Bedroom count
Property type
Last updated on July 30, 2026
Average rent in
Leslieville, Toronto, ON
Average rent in
Last updated on July 30, 2026
Bedroom count
Property type
Median rent
Median rent in Leslieville
$2,500/mo
vs previous year
The average rent in Leslieville is $2,500 per month as of July 2026. This is 30% above the national average rent, or $570 more per month.
average price per square foot
Total rentals
Available rentals in Leslieville
30
for rent on Zumper.com as of July 2026
Rent price distribution
Share of Leslieville rentals at each price point
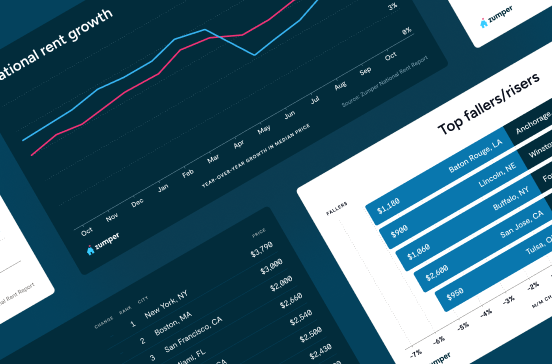
Rent trends in Leslieville, Toronto, ON
Average rent prices in Leslieville have decreased by 5% over the last month and have decreased by 9% since last year.
Rent trends
Rent prices on this page are calculated on a rolling 30-day basis and updated daily.
Compare rent prices in
Leslieville, Toronto, ON
Rent prices in Leslieville vary by bedroom size, rental type, and neighborhood. The average rent for an apartment in Leslieville is $2,480, whereas a house costs $4,850. 1-bedroom apartments in Leslieville run $1,950 on average, while 2-bedroom apartments are $2,747.
Listings | ||||
|---|---|---|---|---|
Studio | $1,800 |  10% | 37% | |
1 bedroom | $2,062 |  4% | 5% | |
2 bedroom | $2,795 | 11% | 20% | |
3 bedroom | $4,392 | 9% | 4% | |
4 bedroom | $6,000 | 51% | 48% |
Listings | ||
|---|---|---|
Cabbagetown | $2,150 | |
East Danforth | $2,125 | |
Regent Park | $2,810 | |
Riverdale | $2,497 | |
Saint Lawrence | $2,350 | |
The Beaches | $2,467 |
Listings | ||||
|---|---|---|---|---|
Apartments | $2,480 | 10% | No Change | |
Condos | $2,775 | 10% | No Change | |
Houses | $4,850 | 15% | No Change | |
Rooms | $1,037 | No Change | - |
Studio
Average rent
$1,800
Last 30 days
10%
Last year
37%
1 bedroom
Average rent
$2,062
Last 30 days
4%
Last year
5%
2 bedroom
Average rent
$2,795
Last 30 days
11%
Last year
20%
3 bedroom
Average rent
$4,392
Last 30 days
9%
Last year
4%
4 bedroom
Average rent
$6,000
Last 30 days
51%
Last year
48%
Cabbagetown
Average rent
$2,150
East Danforth
Average rent
$2,125
Regent Park
Average rent
$2,810
Riverdale
Average rent
$2,497
Saint Lawrence
Average rent
$2,350
The Beaches
Average rent
$2,467
Apartments
Average rent
$2,480
Last 30 days
10%
Condos
Average rent
$2,775
Last 30 days
10%
Houses
Average rent
$4,850
Last 30 days
15%
Rooms
Average rent
$1,037
Last 30 days
No Change
The table above reflects average rent prices in Leslieville, Toronto, ON, broken down by the number of bedrooms, neighborhoods, and property types. The availability of data for each category is dependent on market inventory and will adjust depending on your selected filters.
How does rent in Leslieville, Toronto, ON compare to other neighborhoods?
Compare median rent prices in Leslieville and Cabbagetown by all bedroom counts and property types.
Leslieville
higher than the national median
higher than the national median
Takeaway
The median rent for all rentals in Leslieville, Toronto, ON is 16% higher than the median rent in Cabbagetown, Toronto, ON.
Average rent in nearby neighborhoods
Explore rent trends in neighboring markets
Discover rentals in Leslieville, Toronto, ON

5d+ ago
Leslieville apartment for rent in Toronto
1 bed
1 bath
$1,600
Apartment for rent
Available Aug 1

5d+ ago
Leslieville apartment for rent in Toronto
1 bed
1 bath
$1,650
Apartment for rent
Available Aug 1

5d+ ago
Leslieville apartment for rent in Toronto
1 bed
1 bath
$1,700
Apartment for rent
Available Aug 15

5d+ ago
Leslieville apartment for rent in Toronto
Queen St E & Carlaw Ave, Toronto, ON M4M 2V6
2 beds
1 bath
$2,095
Apartment for rent
Available Aug 1


14h ago
Peyton Lane, Toronto, ON M4M 3R3
2 beds
2 baths
$9,995
Apartment for rent
Available Jan 15

6h ago
1060 Eastern Ave, Toronto, ON M4L 0B8
Studio–3 beds
1–2 baths
$2,025–$5,395
Apartment for rent

5d+ ago
Verified
1 bed
1 bath
$3,600
Loft for rent
Available Jul 3

5d+ ago
Leslieville condo for rent in Toronto
1 bed
1 bath
$2,950
Condo for rent
Available Sep 1


6h ago
1060 Eastern Ave, Toronto, ON M4L 0B8
Studio–3 beds
1–2 baths
$2,025–$5,395
Apartment for rent

2d ago
245 Logan Ave, Toronto, ON M4M 2N2
1 bed
1 bath
$1,900–$2,000
Apartment for rent

2d ago
998 Queen St E, Toronto, ON M4M 1K1
Studio–1 bed
1 bath
$1,800–$2,550
Apartment for rent

5d+ ago
Verified
3 beds
2 baths
$3,825
Apartment for rent
Available Mar 25

4d ago
Verified
1 bed
1 bath
$2,700
$2,500
Price drop
Condo for rent
Available Jul 1

5d+ ago
Verified
1 bed
1 bath
$2,200
Condo for rent
Available Jun 28
5d+ ago
Verified
1 bed
1 bath
$3,600
Loft for rent
Available Jul 3
5d+ ago
Verified
3 beds
2 baths
$5,150
House for rent
Available Aug 1
6h ago
1060 Eastern Ave, Toronto, ON M4L 0B8
Studio–3 beds
1–2 baths
$2,025–$5,395
Apartment for rent
2d ago
245 Logan Ave, Toronto, ON M4M 2N2
1 bed
1 bath
$1,900
Apartment for rent

5d+ ago
926 & 926 Queen Street East, Toronto, ON M4M 1J5
2 beds
1 bath
$2,800
Apartment for rent
5d+ ago
998 Queen St E, Toronto, ON M4M 1K1
1 bed
1 bath
$1,950–$2,550
Apartment for rent

Stay up to date with rental market insights

Are you interested in licensing our current and historical rental real estate data, or do you have custom data requests? Contact datalicensing@zumper.com.
Frequently asked questions for Leslieville, Toronto, ON
Quick answers to common questions about the Leslieville rental market.
How much is rent in Leslieville?
The average rent in Leslieville is $2,500 per month as of July 25, 2026.
Is rent up or down in Leslieville?
Average rent prices in Leslieville have decreased by 5% over the last month and have decreased by 9% since last year.
How does Leslieville rent compare to the national average?
Rent in Leslieville is 30% above the national average, which means renters are paying approximately $570 more per month.
What salary do I need to afford rent in Leslieville?
To comfortably afford rent in Leslieville, you'd need to earn approximately $100,000/year, based on spending no more than 30% of your income on rent.
Methodology
Rent prices are based on Zumper's rental listings from the past 30 days. Median rent is calculated across all available listings and property types on the platform. If you filter the page by bedroom count or property type, the pricing throughout the page will update automatically to reflect that segment of the rental market.
Household and population data come from the U.S. Census Bureau. Cost-of-living data is sourced from the Council for Community and Economic Research's Cost of Living Index (COLI).