
Bedroom count
Property type
Last updated on July 1, 2026
Average rent in
Bayway Isles, St. Petersburg, FL
Average rent in
Last updated on July 1, 2026
Bedroom count
Property type
Median rent
Median rent in Bayway Isles
$2,750/mo
vs previous year
The average rent in Bayway Isles is $2,750 per month as of June 2026. This is 41% above the national average rent, or $800 more per month.
average price per square foot
Total rentals
Available rentals in Bayway Isles
16
for rent on Zumper.com as of June 2026
Rent price distribution
Share of Bayway Isles rentals at each price point
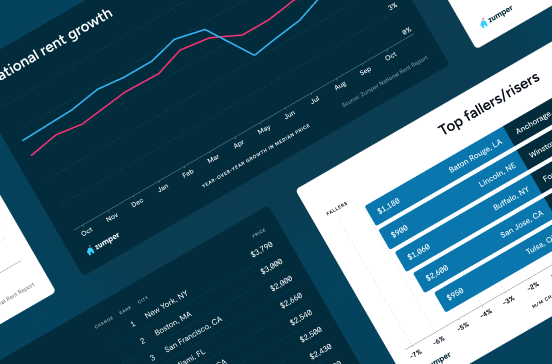
Rent trends in Bayway Isles, St. Petersburg, FL
Average rent prices in Bayway Isles have decreased by 10% over the last month and have increased by 10% since last year.
Rent trends
Rent prices on this page are calculated on a rolling 30-day basis and updated daily.
Compare rent prices in
Bayway Isles, St. Petersburg, FL
Rent prices in Bayway Isles vary by bedroom size, rental type, and neighborhood. The average rent for a house in Bayway Isles is $4,075.
Listings | ||||
|---|---|---|---|---|
1 bedroom | $2,200 |  3% | 32% | |
2 bedroom | $2,800 |  3% | 3% | |
3 bedroom | $3,200 | No Change | - |
Listings | ||
|---|---|---|
Bayview | $2,100 | |
Greater Pinellas Point | $1,525 | |
Isla Del Sol | $2,550 | |
Maximo | $2,600 | |
Sunset Beach | $4,900 | |
Vina Del Mar Island | $4,800 |
Listings | ||||
|---|---|---|---|---|
Condos | $2,750 | 7% | No Change | |
Houses | $4,075 | 25% | No Change |
1 bedroom
Average rent
$2,200
Last 30 days
3%
Last year
32%
2 bedroom
Average rent
$2,800
Last 30 days
3%
Last year
3%
3 bedroom
Average rent
$3,200
Vina Del Mar Island
Average rent
$4,800
Bayview
Average rent
$2,100
Greater Pinellas Point
Average rent
$1,525
Isla Del Sol
Average rent
$2,550
Maximo
Average rent
$2,600
Sunset Beach
Average rent
$4,900
Condos
Average rent
$2,750
Last 30 days
7%
Houses
Average rent
$4,075
Last 30 days
25%
The table above reflects average rent prices in Bayway Isles, St. Petersburg, FL, broken down by the number of bedrooms, neighborhoods, and property types. The availability of data for each category is dependent on market inventory and will adjust depending on your selected filters.
How does rent in Bayway Isles, St Petersburg, FL compare to other neighborhoods?
Compare median rent prices in Bayway Isles and Vina Del Mar Island by all bedroom counts and property types.
Bayway Isles
higher than the national median
higher than the national median
Takeaway
The median rent for all rentals in Bayway Isles, St Petersburg, FL is 43% lower than the median rent in Vina Del Mar Island, St Pete Beach, FL.
Average rent in nearby neighborhoods
Explore rent trends in neighboring markets
Discover rentals in Bayway Isles, St. Petersburg, FL

5d+ ago
Bayway Isles condo for rent in St. Petersburg
4900 Brittany Dr S #411, St. Petersburg, FL 33715
2 beds
2 baths
$1,800
Condo for rent

3d ago
Bayway Isles condo for rent in St. Petersburg
4900 Brittany Dr S #414, St. Petersburg, FL 33715
2 beds
2 baths
$2,300
Condo for rent

5d+ ago
Bayway Isles condo for rent in St. Petersburg
5200 Brittany Dr S #1301, St. Petersburg, FL 33715
2 beds
2 baths
$2,300
Condo for rent

5d+ ago
Bayway Isles condo for rent in St. Petersburg
2 beds
2 baths
$2,300
Condo for rent


5d+ ago
Bayway Isles condo for rent in St. Petersburg
4981 Bacopa Ln S #602, St. Petersburg, FL 33715
2 beds
2 baths
$4,700
Condo for rent

5d+ ago
Bayway Isles condo for rent in St. Petersburg
2 beds
2 baths
$4,000
Condo for rent
Available Jun 5

5d+ ago
Bayway Isles condo for rent in St. Petersburg
5020 Brittany Dr S #125, St. Petersburg, FL 33715
1 bed
1 bath
$1,800
Condo for rent
3d ago
Bayway Isles condo for rent in St. Petersburg
4900 Brittany Dr S #414, St. Petersburg, FL 33715
2 beds
2 baths
$2,300
Condo for rent

5d+ ago
Bayway Isles condo for rent in St. Petersburg
4900 Brittany Dr S #301, St. Petersburg, FL 33715
2 beds
2 baths
$2,800
Condo for rent
Available Jun 12
5d+ ago
Bayway Isles condo for rent in St. Petersburg
5200 Brittany Dr S #1301, St. Petersburg, FL 33715
2 beds
2 baths
$2,300
Condo for rent
5d+ ago
Bayway Isles condo for rent in St. Petersburg
4900 Brittany Dr S #413, St. Petersburg, FL 33715
2 beds
2 baths
$2,500
Condo for rent
Available Jun 12

3d ago
Bayway Isles condo for rent in St. Petersburg
4900 Brittany Dr S #414, St. Petersburg, FL 33715
2 beds
2 baths
$2,300
Condo for rent
5d+ ago
Bayway Isles condo for rent in St. Petersburg
4900 Brittany Dr S #413, St. Petersburg, FL 33715
2 beds
2 baths
$2,500
Condo for rent
Available Jun 12
5d+ ago
Bayway Isles condo for rent in St. Petersburg
4900 Brittany Dr S #301, St. Petersburg, FL 33715
2 beds
2 baths
$2,800
Condo for rent
Available Jun 12
5d+ ago
Bayway Isles condo for rent in St. Petersburg
5020 Brittany Dr S #507, St. Petersburg, FL 33715
2 beds
2 baths
$2,500
Condo for rent
Available Jun 12
Stay up to date with rental market insights

Are you interested in licensing our current and historical rental real estate data, or do you have custom data requests? Contact datalicensing@zumper.com.
Frequently asked questions for Bayway Isles, St. Petersburg, FL
Quick answers to common questions about the Bayway Isles rental market.
How much is rent in Bayway Isles?
The average rent in Bayway Isles is $2,750 per month as of June 27, 2026.
Is rent up or down in Bayway Isles?
Average rent prices in Bayway Isles have decreased by 10% over the last month and have increased by 10% since last year.
How does Bayway Isles rent compare to the national average?
Rent in Bayway Isles is 41% above the national average, which means renters are paying approximately $800 more per month.
What salary do I need to afford rent in Bayway Isles?
To comfortably afford rent in Bayway Isles, you'd need to earn approximately $110,000/year, based on spending no more than 30% of your income on rent.
Methodology
Rent prices are based on Zumper's rental listings from the past 30 days. Median rent is calculated across all available listings and property types on the platform. If you filter the page by bedroom count or property type, the pricing throughout the page will update automatically to reflect that segment of the rental market.
Household and population data come from the U.S. Census Bureau. Cost-of-living data is sourced from the Council for Community and Economic Research's Cost of Living Index (COLI).