
Bedroom count
Property type
Last updated on November 14, 2025
Average rent in
Lower Mary Hill, Port Coquitlam, BC
Last updated on November 14, 2025
Last updated on November 14, 2025
Bedroom count
Property type
As of November 2025, the median rent for all bedroom counts and property types in Lower Mary Hill, Port Coquitlam, BC is $2,775. This is +45%, or $855, higher than the national average.
average price per square foot
Median rent
$2,775
Total rentals
21
for rent on Zumper.com
As of November 2025, the median rent for all bedroom counts and property types in Lower Mary Hill, Port Coquitlam, BC is $2,775. This is +45%, or $855, higher than the national average.
average price per square foot
Rent ranges
Households
At this time, we don't have information to generate a distribution. Please check back soon.
Median rent and rent ranges are based on Zumper inventory in the last 30 days. Household data are provided by the US Census Bureau.
Rent price trends in
Lower Mary Hill, Port Coquitlam, BC
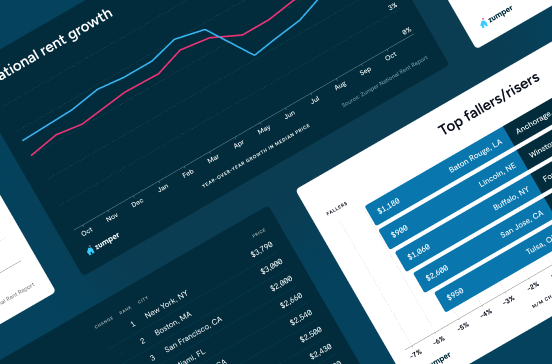
Rent price trends
Rent prices for all bedroom counts and property types in Lower Mary Hill, Port Coquitlam, BC have remained the same in the last month and have increased by 11% in the last year.
Rent prices on this page are calculated on a rolling 30-day basis and updated daily.
Rent comparables in
Lower Mary Hill, Port Coquitlam, BC
The monthly rent for an apartment in Lower Mary Hill, Port Coquitlam, BC is $2,572. A 1-bedroom apartment in Lower Mary Hill, Port Coquitlam, BC costs about $1,924 on average, while a 2-bedroom apartment is $2,650. Houses for rent in Lower Mary Hill, Port Coquitlam, BC are more expensive, with an average monthly cost of $2,994.
Comparables | ||||
|---|---|---|---|---|
1 bedroom | $1,550 | No Change | - | |
2 bedroom | $2,695 | No Change |  12% | |
3 bedroom | $3,000 |  8% | - | |
4 bedroom | $4,000 | No Change | - | |
Studio | $2,380 | - | - |
Comparables | ||
|---|---|---|
Belcara | $2,450 | |
East Newton North | $2,100 | |
Hammond | $2,600 | |
Mary Hill | $2,100 | |
Pitt Meadows City Centre | $2,187 | |
The Ridge | $2,090 |
Comparables | ||||
|---|---|---|---|---|
Apartments | $2,572 | 5% | No Change | |
Condos | $2,672 | - | No Change | |
Houses | $2,994 | No Change | - | |
Rooms | $1,080 | - | No Change |
Studio
Average rent
$2,380
1 bedroom
Average rent
$1,550
2 bedroom
Average rent
$2,695
Last year
12%
3 bedroom
Average rent
$3,000
Last 30 days
8%
4 bedroom
Average rent
$4,000
Hammond
Average rent
$2,600
The Ridge
Average rent
$2,090
Pitt Meadows City Centre
Average rent
$2,187
Mary Hill
Average rent
$2,100
Belcara
Average rent
$2,450
East Newton North
Average rent
$2,100
Apartments
Average rent
$2,572
Last 30 days
5%
Condos
Average rent
$2,672
Houses
Average rent
$2,994
Rooms
Average rent
$1,080
The table above reflects average rent prices in Lower Mary Hill, Port Coquitlam, BC, broken down by the number of bedrooms, neighborhoods, and property types. The availability of data for each category is dependent on market inventory and will adjust depending on your selected filters.
Compare rent prices in Lower Mary Hill, Port Coquitlam, BC to other neighborhoods
Median rent prices in Lower Mary Hill, Port Coquitlam, BC for all bedroom counts and property types compared to Hammond, Maple Ridge, BC.
Lower Mary Hill
higher than the national median
higher than the national median
Takeaway
The median rent for all rentals in Lower Mary Hill, Port Coquitlam, BC is 7% higher than the median rent in Hammond, Maple Ridge, BC.
More data insights and reports

Are you interested in licensing our current and historical rental real estate data, or do you have custom data requests? Contact datalicensing@zumper.com.
Average rent in
Nearby neighborhoods
Explore rent trends in other markets