
Bedroom count
Property type
Last updated on July 31, 2026
Average rent in
O'Fallon, O'Fallon, MO
Average rent in
Last updated on July 31, 2026
Bedroom count
Property type
Median rent
Median rent in O'fallon
$1,997/mo
vs previous year
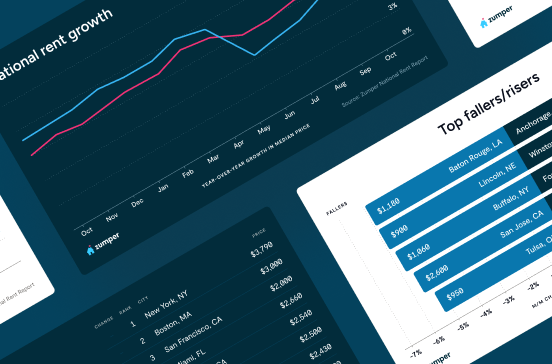
The average rent in O'fallon is $1,997 per month as of July 2026. This is 3% above the national average rent, or $67 more per month.
average price per square foot
Total rentals
Available rentals in O'fallon
38
for rent on Zumper.com as of July 2026
Rent price distribution
Share of O'fallon rentals at each price point
Rent trends in O'Fallon, O'Fallon, MO
Average rent prices in O'fallon have decreased by 4% over the last month and have increased by 18% since last year.
Rent trends
Rent prices on this page are calculated on a rolling 30-day basis and updated daily.
Compare rent prices in
O'Fallon, O'Fallon, MO
Rent prices in O'fallon vary by bedroom size, rental type, and neighborhood. The average rent for an apartment in O'fallon is $1,550, whereas a house costs $2,395. 1-bedroom apartments in O'fallon run $1,450 on average, while 2-bedroom apartments are $1,900.
Listings | ||||
|---|---|---|---|---|
Studio | $1,325 | No Change |  42% | |
1 bedroom | $1,475 | No Change |  38% | |
2 bedroom | $1,600 | No Change | 18% | |
3 bedroom | $2,350 | 3% | 9% | |
4 bedroom | $2,575 | 2% | 8% |
Listings | ||
|---|---|---|
Cave Springs Estates | $1,715 | |
Defiance | $1,650 | |
Hickory Ridge | $2,200 | |
Lake Saint Louis | $1,972 | |
University City | $1,520 | |
Wentzville | $2,100 |
Listings | ||||
|---|---|---|---|---|
Apartments | $1,550 | 1% | No Change | |
Condos | $1,580 | 1% | No Change | |
Houses | $2,395 | 3% | No Change | |
Rooms | $1,500 | No Change | - |
Studio
Average rent
$1,325
Last year
42%
1 bedroom
Average rent
$1,475
Last 30 days
No Change
Last year
38%
2 bedroom
Average rent
$1,600
Last 30 days
No Change
Last year
18%
3 bedroom
Average rent
$2,350
Last 30 days
3%
Last year
9%
4 bedroom
Average rent
$2,575
Last 30 days
2%
Last year
8%
Defiance
Average rent
$1,650
Lake Saint Louis
Average rent
$1,972
Cave Springs Estates
Average rent
$1,715
Hickory Ridge
Average rent
$2,200
University City
Average rent
$1,520
Wentzville
Average rent
$2,100
Apartments
Average rent
$1,550
Last 30 days
1%
Condos
Average rent
$1,580
Last 30 days
1%
Houses
Average rent
$2,395
Last 30 days
3%
Rooms
Average rent
$1,500
The table above reflects average rent prices in O'Fallon, O'Fallon, MO, broken down by the number of bedrooms, neighborhoods, and property types. The availability of data for each category is dependent on market inventory and will adjust depending on your selected filters.
How does rent in O'fallon, O'fallon, MO compare to other neighborhoods?
Compare median rent prices in O'fallon and Defiance by all bedroom counts and property types.
O'fallon
higher than the national median
lower than the national median
Takeaway
The median rent for all rentals in O'fallon, O'fallon, MO is 21% higher than the median rent in Defiance, Defiance, MO.
Average rent in nearby neighborhoods
Explore rent trends in neighboring markets
Discover rentals in O'Fallon, O'Fallon, MO

5d+ ago
Condo for rent in O'Fallon
2 beds
2 baths
$1,499
Condo for rent
Available Jul 13
2d ago
Condo for rent in O'Fallon
333 Stonewall Creek Dr, O'Fallon, MO 63368
2 beds
2 baths
$1,575
Condo for rent

5d+ ago
Condo for rent in O'Fallon
311 Stonewall Creek Dr, O'Fallon, MO 63368
2 beds
2 baths
$1,575
Condo for rent
2d ago
Condo for rent in O'Fallon
143 Stonewall Creek Dr, O'Fallon, MO 63368
3 beds
3 baths
$1,850
Condo for rent


5d+ ago
House for rent in O'Fallon
8003 Knights Crossing Dr, O'Fallon, MO 63368
3 beds
2 baths
$3,500
House for rent

5d+ ago
House for rent in O'Fallon
330 Wabash Woods Way, O'Fallon, MO 63366
3 beds
2.5 baths
$2,900
House for rent

22h ago
Verified
3 beds
2.5 baths
$2,735
House for rent
Available Aug 19

1d ago
100 Mia Rose Way, O'Fallon, MO 63366
Studio–3 beds
1–2 baths
$1,325–$2,550
Apartment for rent


1d ago
210 Dogwood Prairie Dr, O'Fallon, MO 63368
1–2 beds
1–2 baths
$1,410–$1,770
Apartment for rent
1d ago
100 Mia Rose Way, O'Fallon, MO 63366
Studio–3 beds
1–2 baths
$1,325–$2,550
Apartment for rent

5d+ ago
Verified
4 beds
2 baths
$2,465
House for rent
Available Aug 13
1d ago
House for rent in O'Fallon
3 beds
2.5 baths
$2,200
House for rent
Available Aug 12


21h ago
Verified
4 beds
3 baths
$2,810
$2,555
Price drop
House for rent
Available Jul 14

5d+ ago
Verified
4 beds
2.5 baths
$2,960
$2,575
Price drop
House for rent
Available Jul 31

5d+ ago
Verified
5 beds
3.5 baths
$3,725
House for rent
Available Sep 8

22h ago
Verified
3 beds
2.5 baths
$2,800
$2,470
Price drop
House for rent
Available Jul 27


21h ago
Verified
4 beds
3 baths
$2,810
$2,555
Price drop
House for rent
Available Jul 14
22h ago
Verified
3 beds
2.5 baths
$2,800
$2,470
Price drop
House for rent
Available Jul 27
22h ago
Verified
3 beds
2 baths
$2,930
$2,645
Price drop
House for rent
Available Jul 21
5d+ ago
Verified
4 beds
2.5 baths
$2,960
$2,575
Price drop
House for rent
Available Jul 31

Stay up to date with rental market insights

Are you interested in licensing our current and historical rental real estate data, or do you have custom data requests? Contact datalicensing@zumper.com.
Frequently asked questions for O'Fallon, O'Fallon, MO
Quick answers to common questions about the O'fallon rental market.
How much is rent in O'fallon?
The average rent in O'fallon is $1,997 per month as of July 25, 2026.
Is rent up or down in O'fallon?
Average rent prices in O'fallon have decreased by 4% over the last month and have increased by 18% since last year.
How does O'fallon rent compare to the national average?
Rent in O'fallon is 3% above the national average, which means renters are paying approximately $67 more per month.
What salary do I need to afford rent in O'fallon?
To comfortably afford rent in O'fallon, you'd need to earn approximately $80,000/year, based on spending no more than 30% of your income on rent.
Methodology
Rent prices are based on Zumper's rental listings from the past 30 days. Median rent is calculated across all available listings and property types on the platform. If you filter the page by bedroom count or property type, the pricing throughout the page will update automatically to reflect that segment of the rental market.
Household and population data come from the U.S. Census Bureau. Cost-of-living data is sourced from the Council for Community and Economic Research's Cost of Living Index (COLI).