
Bedroom count
Property type
Last updated on April 5, 2026
Average rent in
Lynnmour North, North Vancouver, BC
Last updated on April 5, 2026
Last updated on April 5, 2026
Bedroom count
Property type
As of April 2026, the median rent for all bedroom counts and property types in Lynnmour North, North Vancouver, BC is $3,115. This is +63%, or $1,199, higher than the national average.
average price per square foot
Median rent
$3,115
Total rentals
15
for rent on Zumper.com
As of April 2026, the median rent for all bedroom counts and property types in Lynnmour North, North Vancouver, BC is $3,115. This is +63%, or $1,199, higher than the national average.
average price per square foot
Rent ranges
Households
At this time, we don't have information to generate a distribution. Please check back soon.
Median rent and rent ranges are based on Zumper inventory in the last 30 days. Household data are provided by the US Census Bureau.
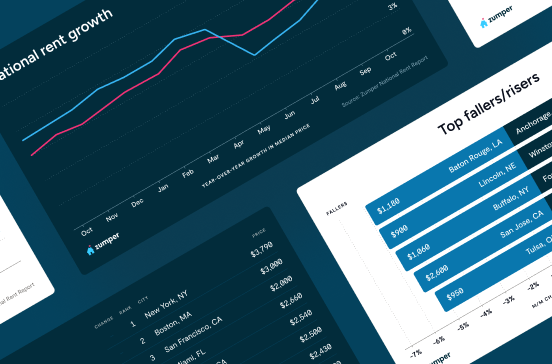
Rent price trends in
Lynnmour North, North Vancouver, BC
Rent price trends
Rent prices for all bedroom counts and property types in Lynnmour North, North Vancouver, BC have remained the same in the last month and have decreased by 3% in the last year.
Rent prices on this page are calculated on a rolling 30-day basis and updated daily.
Rent comparables in
Lynnmour North, North Vancouver, BC
The monthly rent for an apartment in Lynnmour North, North Vancouver, BC is $2,747. A 1-bedroom apartment in Lynnmour North, North Vancouver, BC costs about $2,372 on average, while a 2-bedroom apartment is $3,066. Houses for rent in Lynnmour North, North Vancouver, BC are more expensive, with an average monthly cost of $4,225.
Comparables | ||||
|---|---|---|---|---|
1 bedroom | $2,400 |  17% | - | |
2 bedroom | $3,245 | No Change | 10% | |
3 bedroom | $4,000 | No Change | - | |
4 bedroom | $5,000 | No Change | - | |
Studio | $1,800 | - | - |
Comparables | ||
|---|---|---|
Carisbrooke | $2,599 | |
Kirkstone | $2,825 | |
Lower West Lynn | $2,700 | |
Maplewood | $2,147 | |
Tempe | $2,600 | |
Upper West Lynn | $2,991 |
Comparables | ||||
|---|---|---|---|---|
Apartments | $2,747 | No Change | No Change | |
Condos | $2,695 | 5% | - | |
Houses | $4,225 | No Change | - | |
Rooms | $1,265 | No Change | - |
Studio
Average rent
$1,800
1 bedroom
Average rent
$2,400
Last 30 days
17%
2 bedroom
Average rent
$3,245
Last year
10%
3 bedroom
Average rent
$4,000
4 bedroom
Average rent
$5,000
Carisbrooke
Average rent
$2,599
Kirkstone
Average rent
$2,825
Lower West Lynn
Average rent
$2,700
Maplewood
Average rent
$2,147
Tempe
Average rent
$2,600
Upper West Lynn
Average rent
$2,991
Apartments
Average rent
$2,747
Condos
Average rent
$2,695
Last 30 days
5%
Houses
Average rent
$4,225
Rooms
Average rent
$1,265
The table above reflects average rent prices in Lynnmour North, North Vancouver, BC, broken down by the number of bedrooms, neighborhoods, and property types. The availability of data for each category is dependent on market inventory and will adjust depending on your selected filters.
Compare rent prices in Lynnmour North, North Vancouver, BC to other neighborhoods
Median rent prices in Lynnmour North, North Vancouver, BC for all bedroom counts and property types compared to Carisbrooke, North Vancouver, BC.
Lynnmour North
higher than the national median
higher than the national median
Takeaway
The median rent for all rentals in Lynnmour North, North Vancouver, BC is 20% higher than the median rent in Carisbrooke, North Vancouver, BC.
More data insights and reports

Are you interested in licensing our current and historical rental real estate data, or do you have custom data requests? Contact datalicensing@zumper.com.
Average rent in
Nearby neighborhoods
Explore rent trends in other markets
Discover rentals in Lynnmour North, North Vancouver, BC

5d+ ago
Lynnmour North apartment for rent in North Vancouver
2 beds
1 bath
$2,000
Apartment for rent
Available May 1
5d+ ago
Lynnmour North apartment for rent in North Vancouver
2 beds
1 bath
$2,000
Apartment for rent
Available May 1
5d+ ago
Lynnmour North apartment for rent in North Vancouver
2 beds
1 bath
$2,000
Apartment for rent
Available May 1
5d+ ago
Lynnmour North apartment for rent in North Vancouver
2 beds
1 bath
$2,000
Apartment for rent
Available May 1