
Bedroom count
Property type
Last updated on July 16, 2026
Average rent in
Brigantine, NJ
Average rent in
Last updated on July 16, 2026
Bedroom count
Property type
Key takeaways for renters
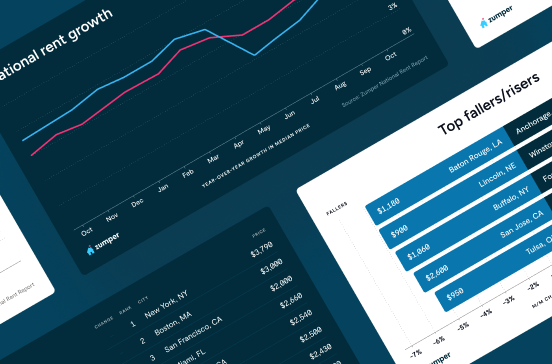
Where Brigantine rent stands today
Brigantine, NJ rent rose 2.2% year over year to a current median of $3,500/month. Month-to-month rent is unchanged as of July 2026, with the median below the 2025 peak of $3,900/month.
Compared to national trends
Brigantine rents run roughly 1.8× the $1,950/month national median, with 84 total rentals available in the market.
Rent ranges by bedroom
Studios in Brigantine rent for $975/month, 1-bedrooms for $1,950/month, and 2-bedrooms for $2,500/month, with 3-bedrooms at $3,300/month and 4+ bedrooms reaching $6,750/month.
Median rent
Median rent in Brigantine
$3,500/mo
vs previous year
The average rent in Brigantine is $3,500 per month as of July 2026. This is 79% above the national average rent, or $1,550 more per month.
average price per square foot
Total rentals
Available rentals in Brigantine
84
for rent on Zumper.com as of July 2026
Rent price distribution
Share of Brigantine rentals at each price point
Rent trends in Brigantine, NJ
Average rent prices in Brigantine have remained the same over the last month and have increased by 2% since last year.
Rent trends
Rent prices on this page are calculated on a rolling 30-day basis and updated daily.
Compare rent prices in
Brigantine, NJ
Rent prices in Brigantine vary by bedroom size, rental type, and neighborhood. The average rent for an apartment in Brigantine is $1,750, whereas a house costs $5,000. 1-bedroom apartments in Brigantine run $1,100 on average, while 2-bedroom apartments are $1,950.
Listings | ||||
|---|---|---|---|---|
Studio | $975 | No Change | - | |
1 bedroom | $1,950 |  55% |  258% | |
2 bedroom | $2,500 | 8% | 3% | |
3 bedroom | $3,300 | 1% | 31% | |
4 bedroom | $6,750 | 2% | 19% |
At this time, we don't have enough active inventory for all rentals to generate data. Please check back soon to see neighborhood rent prices in Brigantine, NJ.
Listings | ||||
|---|---|---|---|---|
Apartments | $1,750 | 12% | No Change | |
Condos | $2,650 | 10% | No Change | |
Houses | $5,000 | 2% | No Change |
Studio
Average rent
$975
1 bedroom
Average rent
$1,950
Last 30 days
55%
Last year
258%
2 bedroom
Average rent
$2,500
Last 30 days
8%
Last year
3%
3 bedroom
Average rent
$3,300
Last 30 days
1%
Last year
31%
4 bedroom
Average rent
$6,750
Last 30 days
2%
Last year
19%
At this time, we don't have enough active inventory for all rentals to generate data. Please check back soon to see neighborhood rent prices in Brigantine, NJ.
Apartments
Average rent
$1,750
Last 30 days
12%
Condos
Average rent
$2,650
Last 30 days
10%
Houses
Average rent
$5,000
Last 30 days
2%
The table above reflects average rent prices in Brigantine, NJ, broken down by the number of bedrooms, neighborhoods, and property types. The availability of data for each category is dependent on market inventory and will adjust depending on your selected filters.
How does rent in Brigantine, NJ compare to other cities?
Compare median rent prices in Brigantine and Absecon by all bedroom counts and property types.
Brigantine
higher than the national median
higher than the national median
Takeaway
The median rent for all rentals in Brigantine, NJ is 59% higher than the median rent in Absecon, NJ.
Average rent in nearby cities
Explore rent trends in neighboring markets
$2,200
$2,100
$2,200
$1,950
$1,900
$2,500
$12,500
$2,375
$4,842
$1,875
$3,000
$10,750
Discover rentals in Brigantine, NJ

5d+ ago
Condo for rent in Brigantine
4901 Harbor Beach Blvd #T12, Brigantine, NJ 08203
2 beds
1 bath
$1,400
Condo for rent

5d+ ago
Apartment for rent in Brigantine
273 38th St S #AB, Brigantine, NJ 08203
2 beds
1 bath
$1,950
Apartment for rent

5d+ ago
Apartment for rent in Brigantine
271 38th St S #A, Brigantine, NJ 08203
2 beds
1 bath
$1,950
Apartment for rent

5d+ ago
House for rent in Brigantine
302 Sheridan Pl, Brigantine, NJ 08203
3 beds
2 baths
$2,500
House for rent


5d+ ago
House for rent in Brigantine
404 21st St S, Brigantine, NJ 08203
5 beds
5.5 baths
$18,000
House for rent

5d+ ago
Condo for rent in Brigantine
4500 W Brigantine Ave #1327, Brigantine, NJ 08203
3 beds
2 baths
$13,500
Condo for rent

5d+ ago
Condo for rent in Brigantine
152 40th St S #152, Brigantine, NJ 08203
2 beds
2 baths
$2,200
Condo for rent
5d+ ago
Apartment for rent in Brigantine
273 38th St S #AB, Brigantine, NJ 08203
2 beds
1 bath
$1,950
Apartment for rent
5d+ ago
Apartment for rent in Brigantine
271 38th St S #A, Brigantine, NJ 08203
2 beds
1 bath
$1,950
Apartment for rent

5d+ ago
House for rent in Brigantine
336 32nd St S, Brigantine, NJ 08203
5 beds
3.5 baths
$8,500
House for rent

5d+ ago
Apartment for rent in Brigantine
141 5th St S #2, Brigantine, NJ 08203
2 beds
1 bath
$2,200
Apartment for rent
5d+ ago
Condo for rent in Brigantine
400 E Brigantine Ave #2C, Brigantine, NJ 08203
3 beds
2 baths
$3,000
Condo for rent
5d+ ago
House for rent in Brigantine
5109 Harbor Beach Blvd, Brigantine, NJ 08203
3 beds
2.5 baths
$3,000
House for rent


5d+ ago
House for rent in Brigantine
4514 Harbor Beach Blvd, Brigantine, NJ 08203
4 beds
2 baths
$3,500
House for rent
5d+ ago
Condo for rent in Brigantine
152 40th St S #152, Brigantine, NJ 08203
2 beds
2 baths
$2,200
Condo for rent
5d+ ago
Apartment for rent in Brigantine
141 5th St S #2, Brigantine, NJ 08203
2 beds
1 bath
$2,200
Apartment for rent

5d+ ago
Condo for rent in Brigantine
702 Lagoon Blvd #A, Brigantine, NJ 08203
3 beds
2.5 baths
$3,500
Condo for rent

Stay up to date with rental market insights

Are you interested in licensing our current and historical rental real estate data, or do you have custom data requests? Contact datalicensing@zumper.com.
Frequently asked questions for Brigantine, NJ
Quick answers to common questions about the Brigantine rental market.
How much is rent in Brigantine?
The average rent in Brigantine is $3,500 per month as of July 11, 2026.
Is rent up or down in Brigantine?
Average rent prices in Brigantine have remained the same over the last month and have increased by 2% since last year.
How does Brigantine rent compare to the national average?
Rent in Brigantine is 79% above the national average, which means renters are paying approximately $1,550 more per month.
What salary do I need to afford rent in Brigantine?
To comfortably afford rent in Brigantine, you'd need to earn approximately $140,000/year, based on spending no more than 30% of your income on rent.
When is the best time of year to rent in Brigantine?
Based on Zumper's July 2026 data, one-bedroom apartments in Brigantine average around $1,520/month and two-bedrooms approximately $2,210/month.
Methodology
Rent prices are based on Zumper's rental listings from the past 30 days. Median rent is calculated across all available listings and property types on the platform. If you filter the page by bedroom count or property type, the pricing throughout the page will update automatically to reflect that segment of the rental market.
Household and population data come from the U.S. Census Bureau. Cost-of-living data is sourced from the Council for Community and Economic Research's Cost of Living Index (COLI).