
Bedroom count
Property type
Last updated on July 16, 2026
Average rent in
Boardman, OH
Average rent in
Last updated on July 16, 2026
Bedroom count
Property type
Median rent
Median rent in Boardman
$937/mo
vs previous year
The average rent in Boardman is $937 per month as of July 2026. This is 52% below the national average rent, or $1,012 less per month.
average price per square foot
Total rentals
Available rentals in Boardman
21
for rent on Zumper.com as of July 2026
Rent price distribution
Share of Boardman rentals at each price point
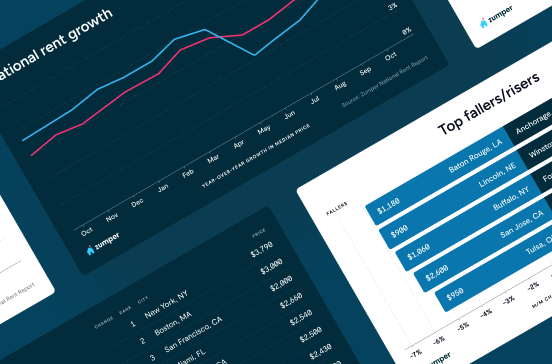
Rent trends in Boardman, OH
Average rent prices in Boardman have increased by 3% over the last month and have increased by 4% since last year.
Rent trends
Rent prices on this page are calculated on a rolling 30-day basis and updated daily.
Compare rent prices in
Boardman, OH
Rent prices in Boardman vary by bedroom size, rental type, and neighborhood. The average rent for an apartment in Boardman is $895, whereas a house costs $1,300. 1-bedroom apartments in Boardman run $875 on average, while 2-bedroom apartments are $900.
Listings | ||||
|---|---|---|---|---|
Studio | $695 |  2% | 7% | |
1 bedroom | $757 | 2% |  9% | |
2 bedroom | $922 | 4% | 5% | |
3 bedroom | $1,200 | 7% | 25% | |
4 bedroom | $1,250 | 44% | 6% |
Listings | ||
|---|---|---|
Applewood Acres | $907 | |
Boardman Estates | $1,000 | |
Boardman Park | $950 | |
Forest Glen Estates | $850 | |
Hitchcock Woods | $875 | |
Indianola Heights | $875 | |
Lockwood Village | $900 | |
Newport Village | $950 | |
Southland Crossing | $900 | |
Tippecanoe Estates | $942 |
Listings | ||||
|---|---|---|---|---|
Apartments | $895 | 2% | No Change | |
Condos | $1,595 | 14% | No Change | |
Houses | $1,300 | 8% | No Change |
Studio
Average rent
$695
Last 30 days
2%
Last year
7%
1 bedroom
Average rent
$757
Last 30 days
2%
Last year
9%
2 bedroom
Average rent
$922
Last 30 days
4%
Last year
5%
3 bedroom
Average rent
$1,200
Last 30 days
7%
Last year
25%
4 bedroom
Average rent
$1,250
Last 30 days
44%
Last year
6%
Applewood Acres
Average rent
$907
Boardman Park
Average rent
$950
Forest Glen Estates
Average rent
$850
Newport Village
Average rent
$950
Hitchcock Woods
Average rent
$875
Tippecanoe Estates
Average rent
$942
Indianola Heights
Average rent
$875
Southland Crossing
Average rent
$900
Boardman Estates
Average rent
$1,000
Lockwood Village
Average rent
$900
Apartments
Average rent
$895
Last 30 days
2%
Condos
Average rent
$1,595
Last 30 days
14%
Houses
Average rent
$1,300
Last 30 days
8%
The table above reflects average rent prices in Boardman, OH, broken down by the number of bedrooms, neighborhoods, and property types. The availability of data for each category is dependent on market inventory and will adjust depending on your selected filters.
How does rent in Boardman, OH compare to other cities?
Compare median rent prices in Boardman and Austintown by all bedroom counts and property types.
Boardman
lower than the national median
lower than the national median
Takeaway
The median rent for all rentals in Boardman, OH is 2% higher than the median rent in Austintown, OH.
Average rent in nearby cities
Explore rent trends in neighboring markets
Discover rentals in Boardman, OH

2d ago
Apartment for rent in Boardman
432 Mathews Rd, Boardman, OH 44512
2 beds
1 bath
$850
Apartment for rent

3d ago
98 Washington Blvd, Boardman, OH 44512
2 beds
1 bath
$850
Apartment for rent

1d ago
Boardman Park townhouse for rent in Boardman
7035 Paxton Rd, Boardman, OH 44512
3 beds
1.5 baths
$950
$890
Price drop
House for rent
Available Jul 18

5d+ ago
House for rent in Boardman
158 Beechwood Dr #1, Boardman, OH 44512
3 beds
1.5 baths
$1,100
House for rent
Available Jun 1

5d+ ago
Tippecanoe Estates condo for rent in Boardman
3649 Indian Run Dr, Boardman, OH 44406
2 beds
2 baths
$1,600
Condo for rent

5d+ ago
Newport Village condo for rent in Boardman
60 Prestwick Dr #60, Boardman, OH 44512
2 beds
2 baths
$1,595
Condo for rent
Available Jul 7

5d+ ago
Applewood Acres apartment for rent in Boardman
2 beds
2 baths
$1,525
Apartment for rent
Available Jul 9
21h ago
403 Rockdale Ave, Boardman, OH 44512
1 bed
1 bath
$735–$895
Apartment for rent


1d ago
Boardman Park townhouse for rent in Boardman
7035 Paxton Rd, Boardman, OH 44512
3 beds
1.5 baths
$950
$890
Price drop
House for rent
Available Jul 18
5d+ ago
Newport Village condo for rent in Boardman
60 Prestwick Dr #60, Boardman, OH 44512
2 beds
2 baths
$1,595
Condo for rent
Available Jul 7
5d+ ago
House for rent in Boardman
158 Beechwood Dr #1, Boardman, OH 44512
3 beds
1.5 baths
$1,100
House for rent
Available Jun 1
5d+ ago
7350 West Blvd, Boardman, OH 44512
Studio–1 bed
1 bath
$675–$725
Apartment for rent

5d+ ago
7125 Locust Ave, Boardman, OH 44512
2 beds
1 bath
$950
Apartment for rent

3d ago
4902 Brookwood Rd, Boardman, OH 44512
2 beds
2 baths
$925
Apartment for rent
5d+ ago
7185 Locust Ave, Boardman, OH 44512
1 bed
1 bath
$875
Apartment for rent


5d+ ago
Apartment for rent in Boardman
5240 Old Oxford Ln, Boardman, OH 44512
3 beds
2 baths
$1,850
$1,800
Price drop
Apartment for rent
1d ago
Boardman Park townhouse for rent in Boardman
7035 Paxton Rd, Boardman, OH 44512
3 beds
1.5 baths
$950
$890
Price drop
House for rent
Available Jul 18
2d ago
Apartment for rent in Boardman
432 Mathews Rd, Boardman, OH 44512
2 beds
1 bath
$850
Apartment for rent
3d ago
98 Washington Blvd, Boardman, OH 44512
2 beds
1 bath
$850
Apartment for rent

Stay up to date with rental market insights

Are you interested in licensing our current and historical rental real estate data, or do you have custom data requests? Contact datalicensing@zumper.com.
Frequently asked questions for Boardman, OH
Quick answers to common questions about the Boardman rental market.
How much is rent in Boardman?
The average rent in Boardman is $937 per month as of July 11, 2026.
Is rent up or down in Boardman?
Average rent prices in Boardman have increased by 3% over the last month and have increased by 4% since last year.
How does Boardman rent compare to the national average?
Rent in Boardman is 52% below the national average, which means renters are paying approximately $1,012 less per month.
Which neighborhoods are most affordable in Boardman?
The most affordable neighborhoods in Boardman are Forest Glen Estates ($850/mo), Hitchcock Woods ($875/mo), and Indianola Heights ($875/mo).
What salary do I need to afford rent in Boardman?
To comfortably afford rent in Boardman, you'd need to earn approximately $38,000/year, based on spending no more than 30% of your income on rent.
When is the best time of year to rent in Boardman?
Boardman's 2025 rental market shows one-bedroom apartments averaging around $840 per month, while two-bedroom units average around $920 per month. These figures reflect the city's accessible pricing structure across different apartment sizes.
Methodology
Rent prices are based on Zumper's rental listings from the past 30 days. Median rent is calculated across all available listings and property types on the platform. If you filter the page by bedroom count or property type, the pricing throughout the page will update automatically to reflect that segment of the rental market.
Household and population data come from the U.S. Census Bureau. Cost-of-living data is sourced from the Council for Community and Economic Research's Cost of Living Index (COLI).