Canada’s rental market stabilized last month, as delayed seasonal demand arrived. After May’s temporary softening interrupted the market’s earlier deceleration, June brought a peak-season rise: the national one-bedroom index surpassed May’s level, annual declines narrowed for both bedroom types, and about half of all tracked markets saw monthly gains.
National Rent Index: The Seasonal Lift Arrives
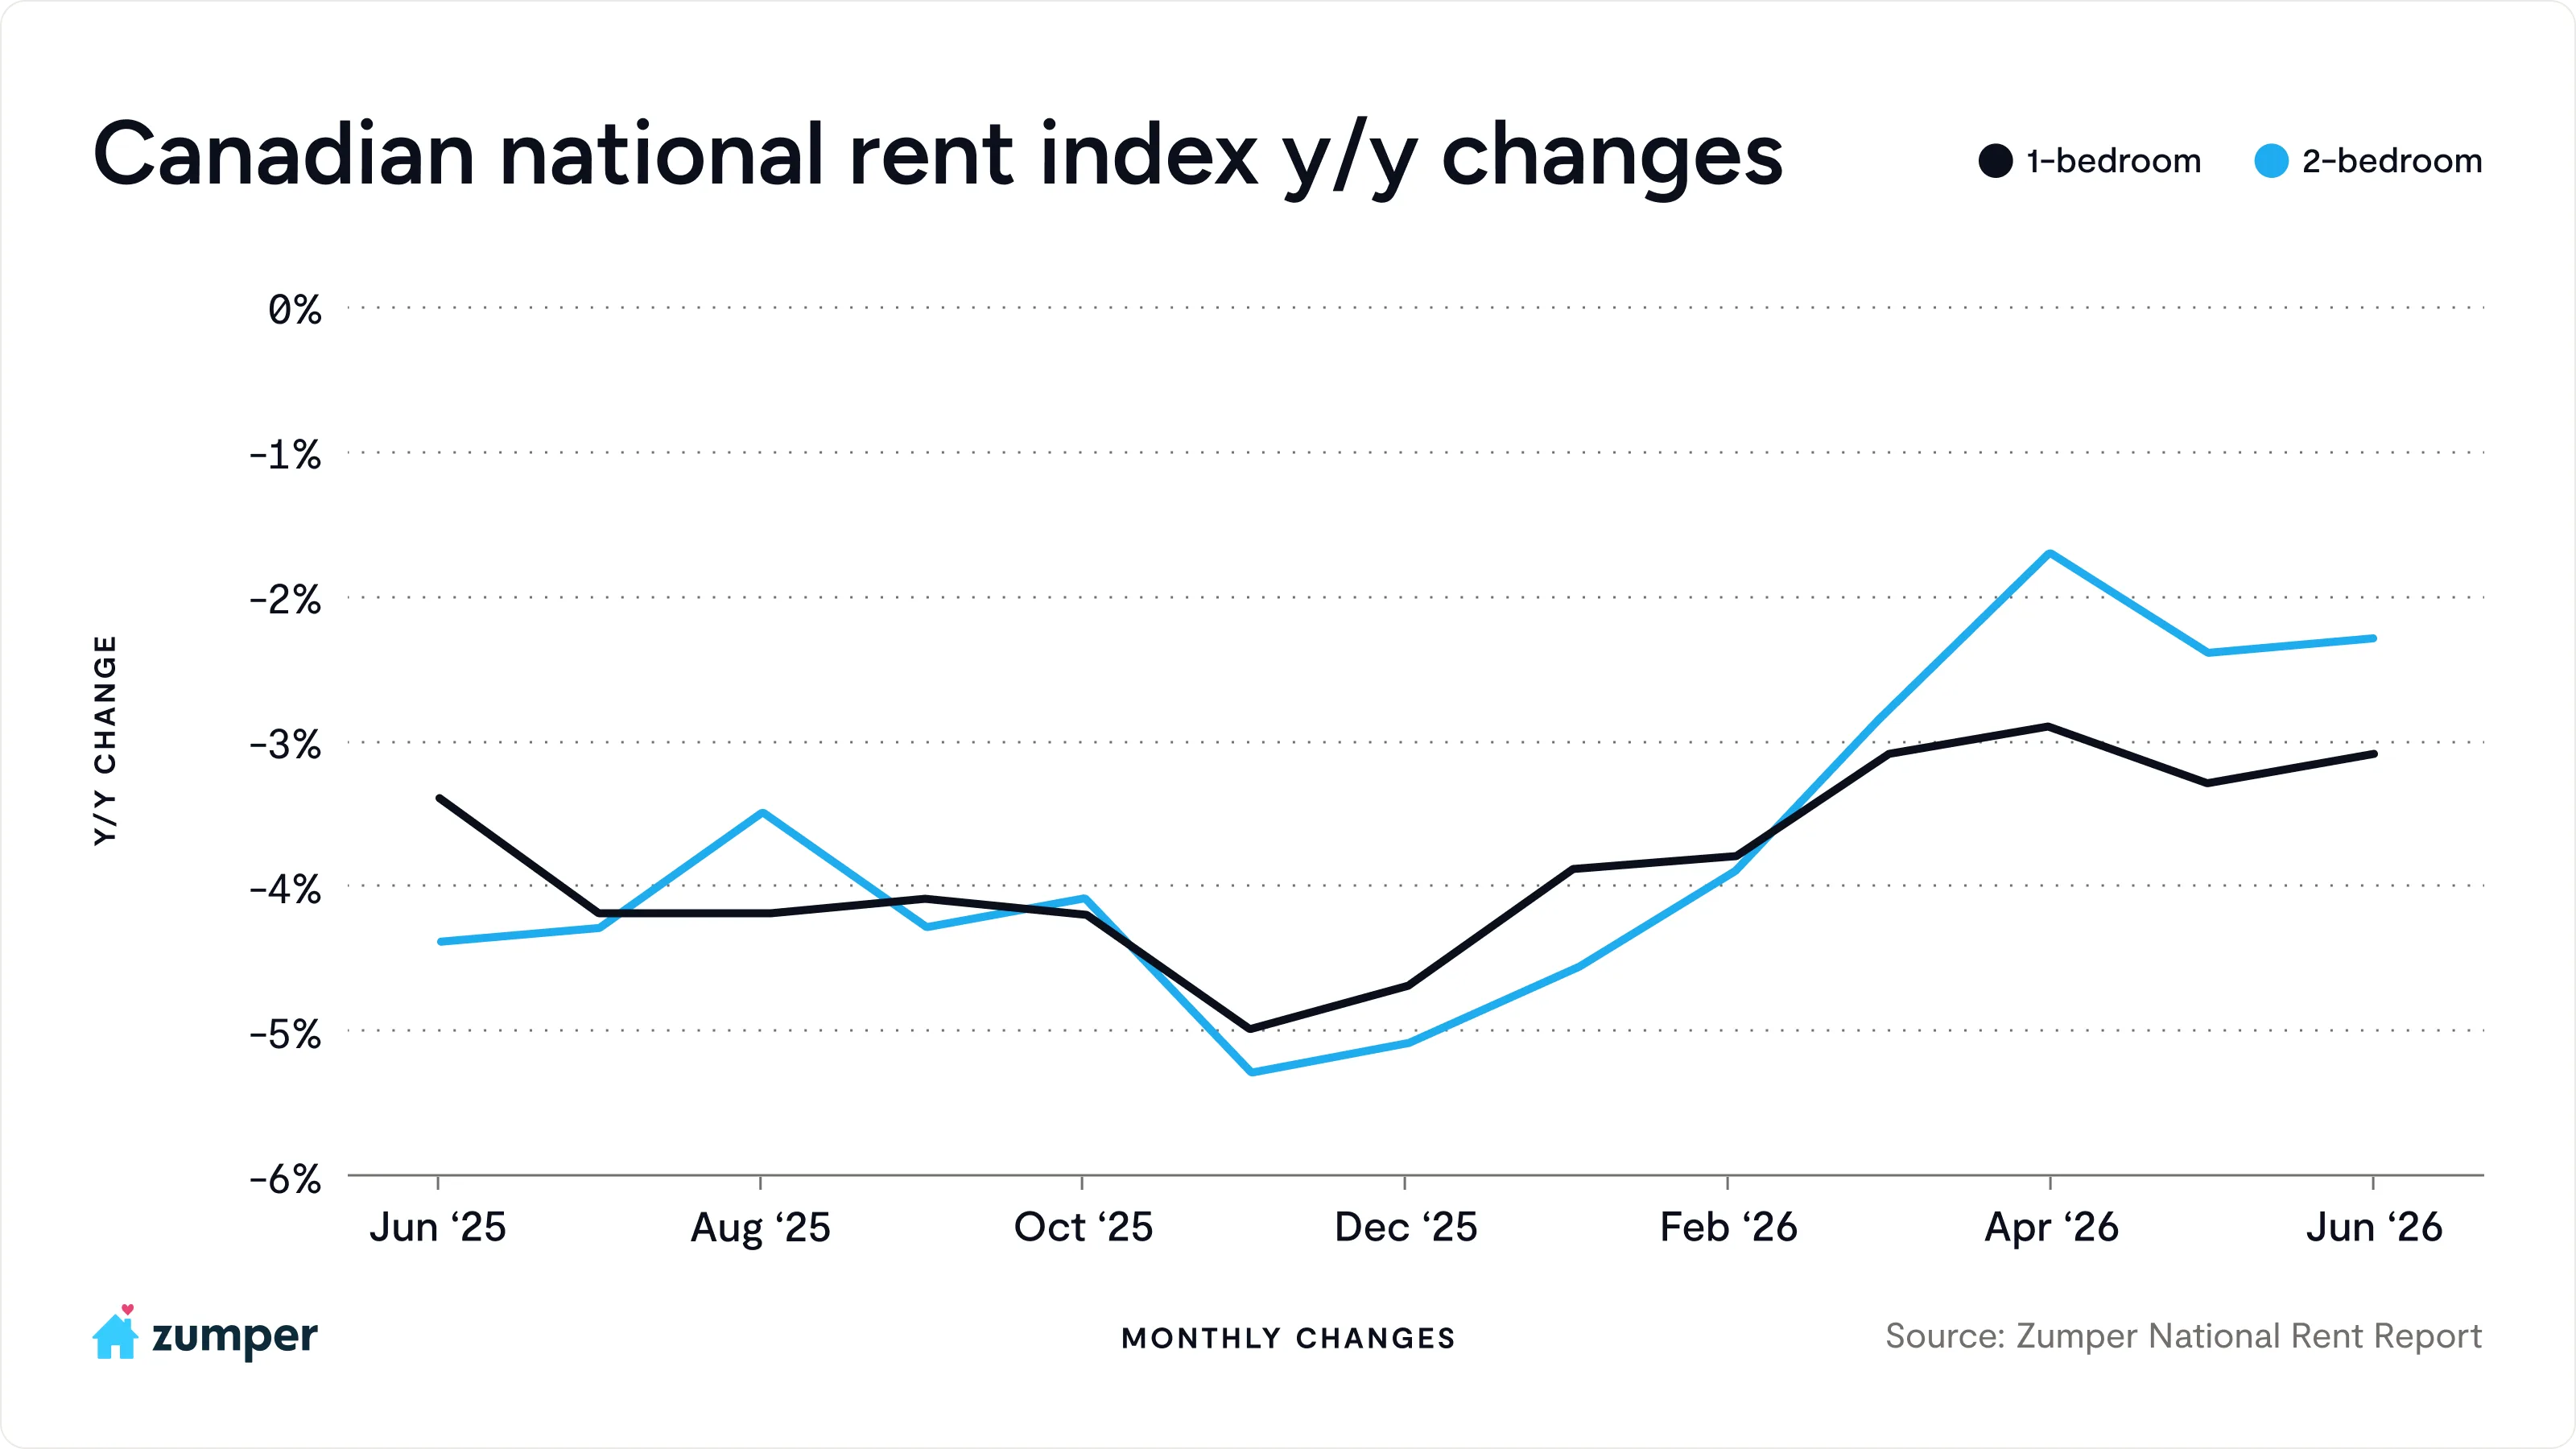
Zumper’s Canadian National Rent Index shows one-bedrooms rose 0.3% month-over-month in June to $1,779, while two-bedrooms increased 0.2% to $2,200. On an annual basis, one-bedrooms are down 3.1%, and two-bedrooms are down 2.3%.
June reverses May’s setback. Both bedroom types had declined month-over-month in May, breaking a four-month run of narrowing annual declines and raising the question of whether peak leasing season would deliver its usual demand. Then, in June, the return to positive monthly growth combined with the annual rate for one-bedrooms narrowing from -3.3% back to -3.1%, suggests that the late-spring demand uptick that stalled in May has started to take hold as the market moves deeper into its traditional May-through-August leasing window.
However, the macro backdrop hasn’t changed as reduced temporary resident inflows continue to weigh on population growth, and structural demand remains soft relative to the pandemic years. What June adds is a seasonal counterweight. Peak-season leasing is doing what it typically does, lifting rents at the margin even against a weaker structural base. For renters, the environment stays favorable as one-bedrooms remain cheaper than a year ago in the large majority of tracked markets, and incentives are still common. The question now shifts to July and August and whether the summer can sustain this momentum.
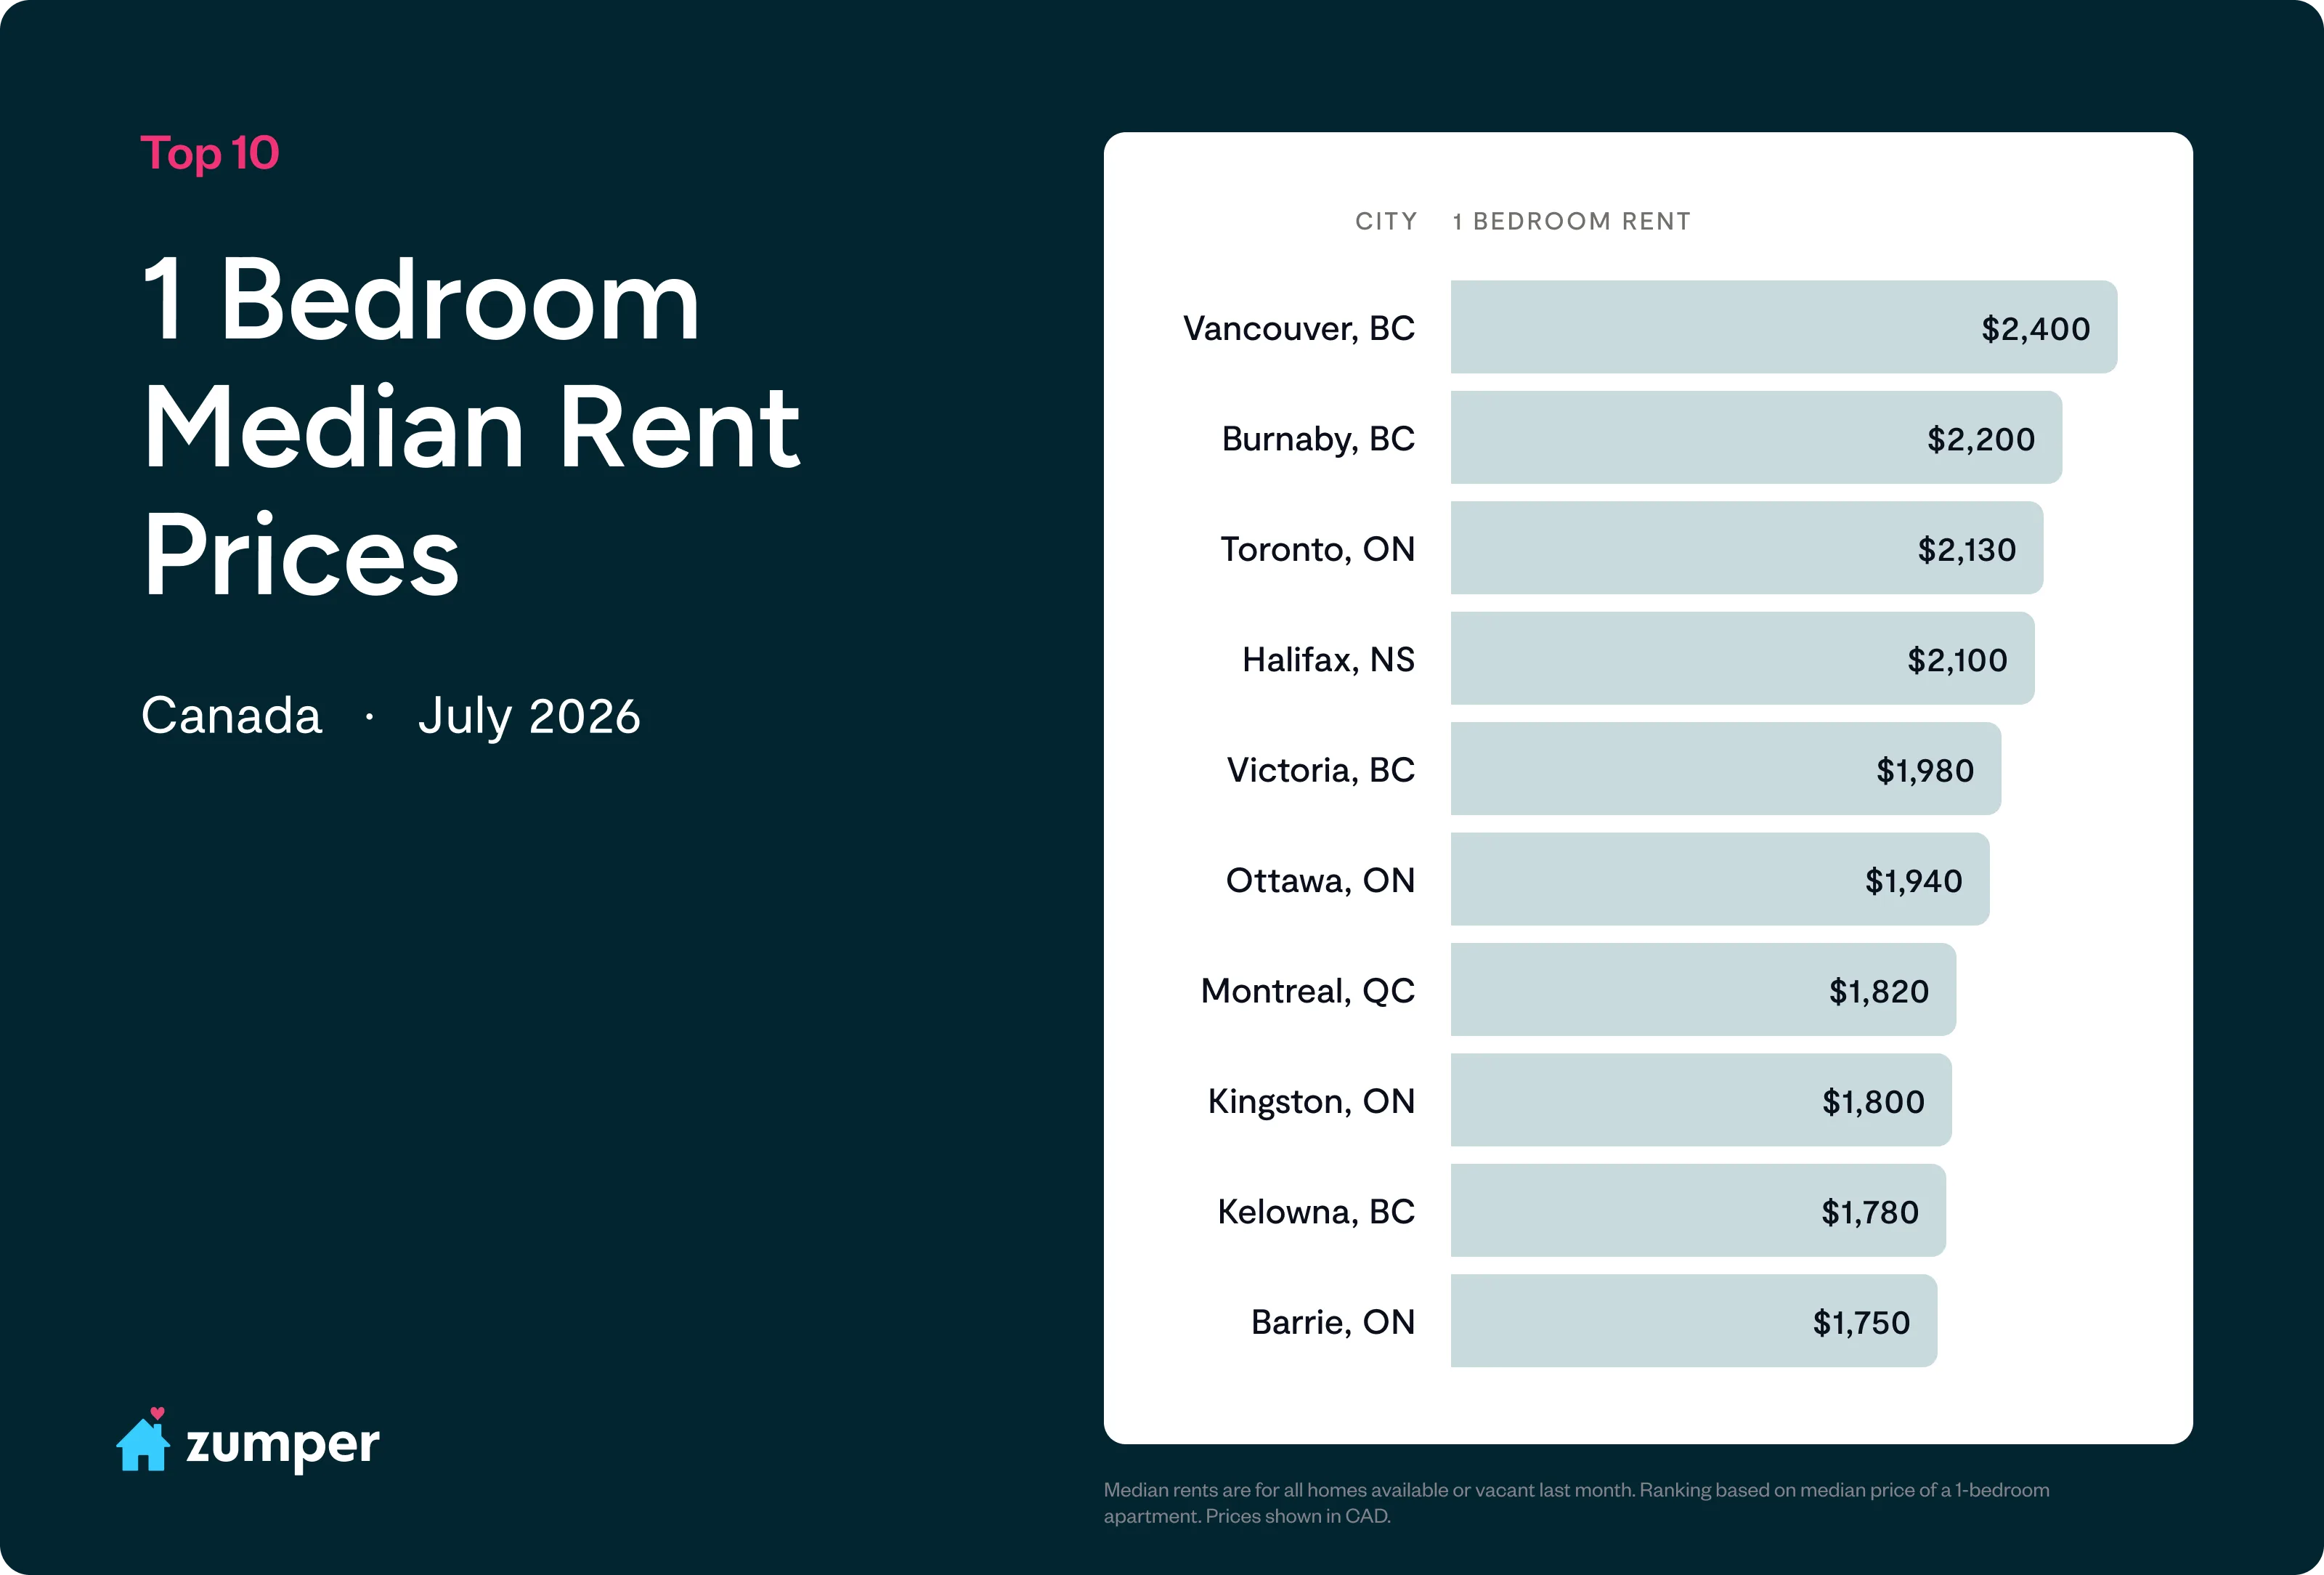
Movement in the Top 10 Cities
Toronto reclaims sole possession of #3. A 1.4% monthly gain lifted Toronto to $2,130, edging past Halifax, which had tied it a month ago.
Halifax slips to #4. Nova Scotia’s capital held flat month-over-month at $2,100 after May’s 5% surge, and a stable month was enough to drop it one spot as Toronto pulled ahead.
Ottawa rises to #6. A 1.6% monthly increase pushed Ottawa to $1,940 and up one spot.
Montréal climbs to #7. Québec’s largest market moved up a spot to $1,820.
Kingston tumbles to #8. Kingston fell two spots after a 6.3% monthly decline, the steepest drop in the top 10.
Biggest Movers: Strongest Annual Rent Growth
Montréal, QC +9%
Québec City, QC +5.3%
Kingston, ON +2.9%
Montréal and Québec City now sit at the top of the national growth leaderboard. Montréal accelerated past its April-May pace to claim the top spot. The province saw a residential construction surge in 2025, backed by provincial, municipal, and Housing Accelerator Fund measures. That new supply seems to have been absorbed without leading to the oversupply conditions that weigh on Ontario and B.C. Sustained interprovincial inflows and an economy more insulated from trade uncertainty help support a broad renter base. Kingston rounds out the top three with its annual growth cooled sharply from double digits to 2.9%.
Biggest Declines: Largest Annual Rent Drops
Kelowna, BC -11.4%
Victoria, BC -7.9%
St.Catharines, ON -7.6%
Kelowna’s -11.4% remains the steepest decline in the country, though it narrowed slightly from last month. The Okanagan city absorbed remote worker demand during the pandemic years, and as patterns normalized, a wave of newly completed rental units flowed into a softening market. Victoria’s -7.9% narrowed from -9.3% but keeps B.C.’s capital in the cooling that has spread well beyond Vancouver. St. Catharines steps into the third spot at -7.6%, extending the southern Ontario softness that has run through Hamilton and the broader GTA-adjacent commuter belt as the pandemic-era affordability premium continues to unwind.
Regional Snapshot
British Columbia: B.C. remains the weakest major region annually, but June saw a uniform monthly rebound. Vancouver, Burnaby, Victoria, Kelowna, and Abbotsford all posted monthly gains. Annual figures remain deep in negative territory: Abbotsford -1.8%, Vancouver -5.5%, Burnaby -6.4%, Victoria -7.9%, and Kelowna -11.4%. The monthly gains reflect peak-season demand, but the ongoing record supply pipeline is expected to keep downward pressure on rents.
Ontario: The province’s correction is easing at the margins but remains uneven. Toronto and Ottawa both narrowed annual declines and posted monthly gains; Hamilton reduced its annual drop. St. Catharines is now the steepest annual decliner, with Kitchener and Windsor close behind. London and Barrie held steady. Kingston remains positive.
Québec: Montréal and Québec City continue to be the country’s strongest major markets by annual growth, extending Québec’s run at the top. The province’s durable demand continues to set it apart from the national softness.
Prairies: The Prairies softened while other regions firmed. Regina slipped to -3.1% annually after holding positive growth last month, and Winnipeg’s annual growth flattened. Calgary’s -5.3% decline weakened from near-flat, and Edmonton’s -7.4% became one of the steepest nationwide. Saskatoon is held annually.
Atlantic Canada: Halifax held flat month-over-month at $2,100 after May’s surge, giving back a little ground annually to -1.9%. Slowing near-term supply additions could put pressure on rents in the months ahead.
Full Data
| 1 Bedroom | 1 Bedroom | 1 Bedroom | 2 Bedrooms | 2 Bedrooms | 2 Bedrooms | |||
|---|---|---|---|---|---|---|---|---|
| Ranking | Ranking Change | City | Price | M/M% | Y/Y% | Price | M/M% | Y/Y% |
| 1 | 0 | Vancouver, BC | $2,400 | 2.10% | -5.50% | $3,370 | 0.90% | -2.90% |
| 2 | 0 | Burnaby, BC | $2,200 | 0.50% | -6.40% | $2,750 | 1.90% | -4.80% |
| 3 | 0 | Toronto, ON | $2,130 | 1.40% | -5.30% | $2,690 | 1.10% | -5.60% |
| 4 | -1 | Halifax, NS | $2,100 | 0.00% | -1.90% | $2,500 | 0.00% | -2.00% |
| 5 | 0 | Victoria, BC | $1,980 | 1.00% | -7.90% | $2,630 | 4.00% | -5.70% |
| 6 | 1 | Ottawa, ON | $1,940 | 1.60% | -3.00% | $2,400 | -0.40% | -4.00% |
| 7 | 1 | Montreal, QC | $1,820 | -0.50% | 9.00% | $2,280 | -2.10% | 4.10% |
| 8 | -2 | Kingston, ON | $1,800 | -6.30% | 2.90% | $2,320 | -3.70% | 22.10% |
| 9 | 0 | Kelowna, BC | $1,780 | 1.10% | -11.40% | $2,230 | -1.30% | -7.10% |
| 10 | 0 | Barrie, ON | $1,750 | 0.00% | 0.00% | $1,950 | -2.50% | -2.50% |
| 11 | 0 | Oshawa, ON | $1,700 | 0.00% | -2.90% | $1,980 | 0.50% | -1.00% |
| 12 | 0 | Kitchener, ON | $1,660 | -0.60% | -6.70% | $1,940 | 1.00% | -7.60% |
| 12 | 1 | London, ON | $1,660 | 0.00% | 0.60% | $2,050 | 0.00% | 2.00% |
| 14 | 1 | Hamilton, ON | $1,650 | 3.10% | -5.70% | $2,150 | 4.90% | 7.50% |
| 14 | 0 | Abbotsford, BC | $1,650 | 0.60% | -1.80% | $2,050 | 2.50% | -6.40% |
| 16 | -1 | Calgary, AB | $1,600 | 0.00% | -5.30% | $1,950 | -1.50% | -3.50% |
| 17 | 0 | St.Catharines, ON | $1,460 | -3.90% | -7.60% | $1,800 | -2.70% | -5.30% |
| 18 | 1 | Winnipeg, MB | $1,450 | 0.00% | 0.00% | $1,750 | -0.60% | 2.90% |
| 19 | -1 | Quebec, QC | $1,390 | -6.10% | 5.30% | $1,700 | -0.60% | 0.00% |
| 20 | 0 | Windsor, ON | $1,320 | -1.50% | -5.70% | $1,610 | 0.60% | -2.40% |
| 21 | 0 | Saskatoon, SK | $1,300 | 1.60% | 0.00% | $1,600 | 2.60% | 0.60% |
| 22 | 1 | Edmonton, AB | $1,250 | 0.80% | -7.40% | $1,610 | 0.60% | -3.00% |
| 22 | -1 | Regina, SK | $1,250 | -2.30% | -3.10% | $1,530 | -1.30% | -2.50% |
About
The Zumper Canadian Rent Report analyzes rental data from hundreds of thousands of active listings across the country. Listings are then aggregated on a monthly basis to calculate median asking rents for the top 23 most populous metro areas, providing a comprehensive view of the current state of the market. The report is based on all data available in the month prior to publication. Any data that is reported does not include short term listings. View our full methodology here.
To keep up to date with the latest rent trends or company news, like or follow Zumper on Facebook, X, and Instagram. In the market for a new place? Search apartments for rent on Zumper.
Related content


