As we move deeper into the summer season, last month was, surprisingly, another month of stable rents in the top 10 markets. For the rest of the nation, Denver, ranking as the 16th priciest city, had the largest monthly growth rate for one bedroom rent, up 4.9%. Meanwhile, Akron, our most affordable city, saw the biggest rent dip in the nation, falling 5%. Large year over year changes for both bedroom types remained prevalent throughout but with an emphasis in the mid to lower tiered markets.
Overall, the national one bedroom median decreased a slight 0.1% to $1,208, while two bedrooms grew 0.3% to $1,446. On a year over year basis, both bedroom types is up around 3%.

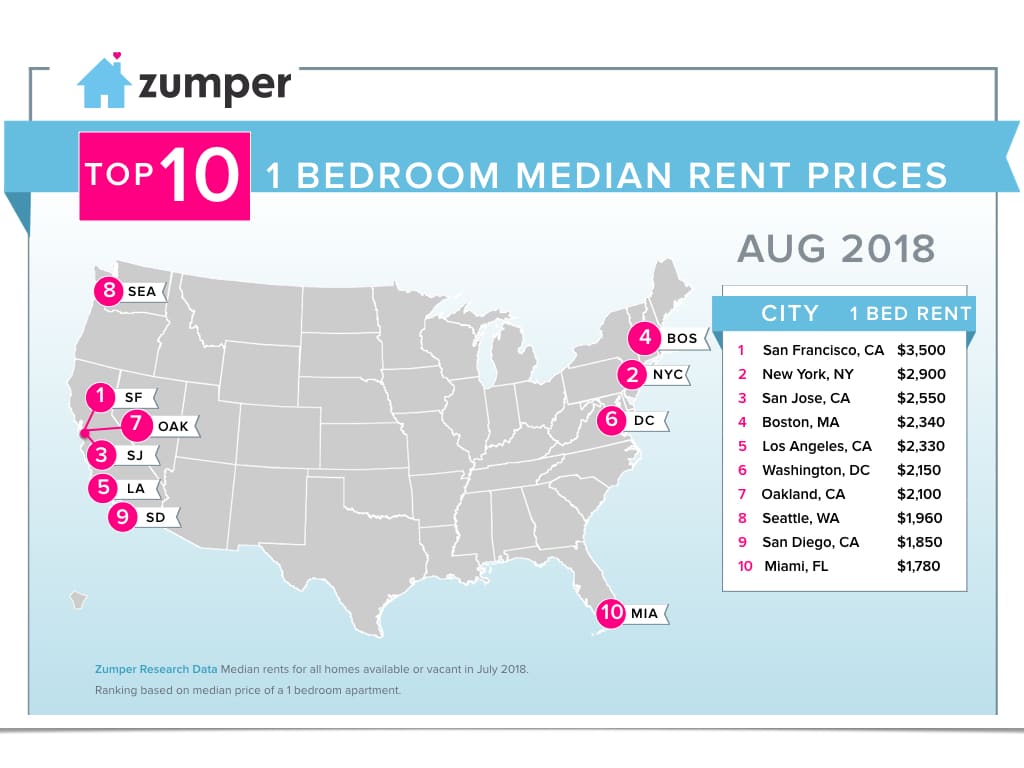
Top Five Rental Markets
1. San Francisco, Californie had another flat month with one bedrooms rent staying stable at $3,500 and two bedrooms increasing 1.1% to $4,730.
2. New York, NY saw one bedroom rent increase 1.4% to $2,900, while two bedrooms grew 2.2% to $3,290.
3. San Jose, CA remained the third priciest city with one bedroom rent rising 2.8% to $2,550 and two bedrooms remaining flat at $3,010.
4. Boston, Massachusetts moved up one spot, barely inching past Los Angeles, to rank as fourth. One bedroom rent here grew 0.9% to $2,340, while two bedrooms were flat at $2,750.
5. Los Angeles, Californie fell to fifth with one bedroom rent dropping 1.3% to $2,330 while two bedrooms had a more dramatic decrease, down 3% to $3,210.
Notable Changes This Month
![]() Upward
Upward
–Denver, Colorado one bedroom rent had the largest monthly growth rate in the nation, climbing 4.9%, settling at $1,500, and up five spots to become sixteenth.
–Fort Worth, TX rose six spots to become the fortieth priciest city. One bedroom rent jumped 4.8% to $1,100, while two bedrooms grew 3.1% to $1,310.
–Anchorage, AK also shot up six spots, now ranking as the fifty-ninth priciest market. One bedroom rent grew 4.7% to $900, while two bedrooms increased 2.8% to $1,100.
–Arlington, TX saw a three ranking bump up to seventy-third with the price of one bedrooms climbing 3.8% to $810 and two bedrooms growing 2.9% to $1,080.
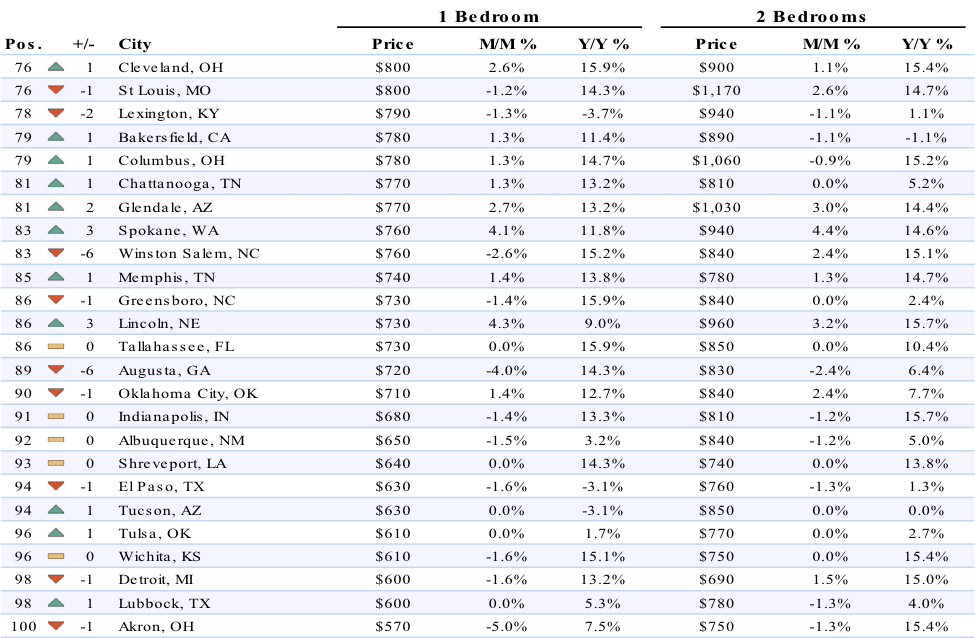
–Spokane, WA one bedroom rent moved up three positions to become eighty-third. One bedroom rent jumped 4.1% to $760, while two bedrooms had an ever larger growth rate, up 4.4% to $940.
![]() Downward
Downward
–Providence, RI fell four spots to become the twenty-third most expensive city. One bedroom rent decreased 4.9% to $1,370, while two bedrooms were flat at $1,520.
–New Orleans, LA saw one bedroom rent drop 4.3%, settling at $1,340, and down two spots to rank as twenty-fifth. Two bedroom rent was down 3.8% to $1,530.
–Charlotte, Caroline du Nord took a three ranking dip to thirty-third with one bedroom rent falling 4.8% to $1,180 and two bedrooms dropping 5.1% to $1,290.
–Syracuse, NY moved down seven positions to become the sixty-fourth most expensive city. One bedroom rent decreased 4.4% to $870.
–Akron, OH one bedroom rent had the largest monthly decline, dropping 5% to $570, and also moved down one spot to become the most affordable city in the nation.
Full Data
| 1 Bedroom | 2 Bedrooms | ||||||
|---|---|---|---|---|---|---|---|
| Pos. | City | Price | M/M % | Y/Y % | Price | M/M % | Y/Y % |
| 1 | Mountain View | $3,570 | 2.30% | 11.20% | $4,180 | -3.20% | 9.70% |
| 2 | San Francisco | $3,500 | 0.00% | 2.30% | $4,730 | 1.10% | 5.10% |
| 3 | Redwood City | $3,240 | 2.50% | 4.90% | $3,840 | -5.00% | 2.40% |
| 4 | Sunnyvale | $3,060 | 0.00% | 12.90% | $3,700 | -3.90% | 15.60% |
| 5 | Palo Alto | $2,960 | 5.00% | 3.50% | $3,880 | 4.90% | -8.50% |
| 6 | Emeryville | $2,890 | -3.70% | 5.50% | $3,670 | -4.20% | 2.20% |
| 7 | Santa Clara | $2,800 | -5.10% | 11.60% | $3,330 | -5.10% | 12.10% |
| 8 | San Mateo | $2,790 | 4.90% | 9.80% | $3,660 | -0.80% | 5.50% |
| 9 | Milpitas | $2,740 | 0.00% | 15.60% | $3,260 | 4.50% | 15.60% |
| 10 | San Jose | $2,550 | 2.80% | 7.10% | $3,010 | 0.00% | 6.70% |
| 11 | South San Francisco | $2,520 | -4.90% | 10.00% | $3,320 | -4.60% | -2.40% |
| 12 | Daly City | $2,440 | -5.10% | 7.00% | $3,210 | -1.20% | 10.70% |
| 13 | Union City | $2,430 | -5.10% | 12.00% | $2,740 | 5.00% | 10.00% |
| 14 | Berkeley | $2,400 | -4.00% | -3.60% | $3,300 | -4.90% | 0.00% |
| 15 | Burlingame | $2,360 | -1.70% | -2.50% | $3,620 | 0.80% | 15.30% |
| 16 | Fremont | $2,290 | -0.40% | 4.10% | $2,660 | 1.50% | 4.70% |
| 17 | Pleasanton | $2,260 | 2.70% | 0.40% | $2,750 | 3.00% | 5.80% |
| 18 | Walnut Creek | $2,200 | -5.20% | 1.40% | $2,580 | -0.40% | -4.40% |
| 19 | San Ramon | $2,120 | 0.00% | 1.00% | $2,630 | 0.40% | 4.40% |
| 20 | Alameda | $2,100 | -3.70% | 7.70% | $2,700 | 1.50% | -1.10% |
| 20 | Oakland | $2,100 | 0.00% | -1.40% | $2,500 | 0.80% | -1.20% |
| 22 | Petaluma | $1,960 | 4.80% | -6.70% | $2,560 | 1.60% | 8.50% |
| 23 | Hayward | $1,920 | -2.00% | 3.20% | $2,400 | 0.00% | 6.70% |
| 24 | San Leandro | $1,870 | -1.60% | -4.60% | $2,350 | 0.40% | 5.40% |
| 25 | Livermore | $1,800 | 0.60% | 11.80% | $2,380 | 4.80% | 5.30% |
| 25 | Richmond | $1,800 | 0.60% | 0.00% | $2,270 | 4.60% | 6.10% |
| 27 | Concord | $1,710 | 0.60% | 6.90% | $2,050 | 1.50% | 10.80% |
| 27 | Napa | $1,710 | -2.80% | 6.90% | $2,100 | 5.00% | -2.80% |
| 29 | Santa Rosa | $1,640 | 5.10% | 5.80% | $2,100 | -2.80% | 8.20% |
| 30 | Vallejo | $1,350 | 0.00% | 3.80% | $1,650 | 2.50% | 1.90% |
About
The Zumper National Rent Report analyses rental data from over 1 million active listings across the United States. Data is aggregated on a monthly basis to calculate median asking rents for the top 100 metro areas by population, providing a comprehensive view of the current state of the market. The report is based on all data available in the month prior to publication.
If you’re interested in a more in-depth explanation of how and why we calculate our rent data, view our methodology post.
To keep up to date with rent changes across the country, like or follow Zumper on Facebook, Gazouillement, and Instagram. In the market for a new place? Search apartments for rent on Zumper.
Contenu associé