The top 10 markets held on steady to both their rankings and prices, for the most part, last month. While San Francisco rent prices for both bedroom types remained flat, maybe some good news to renters there, San Diego, the only city in the top markets with a large rental growth rate, saw rent climb 5.3% and up two spots.
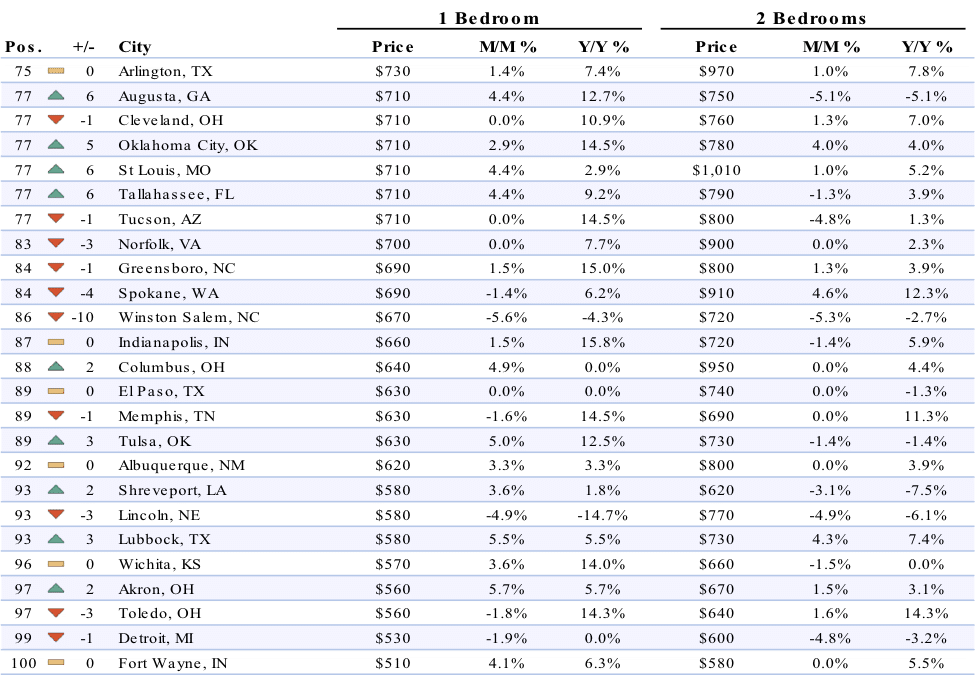
Looking at the rest of the nation, there was a lot more movement in the rankings with some cities even dropping as much as 10 spots, like Winston Salem, and some markets moving up as much as 6 spots, like St. Louis.
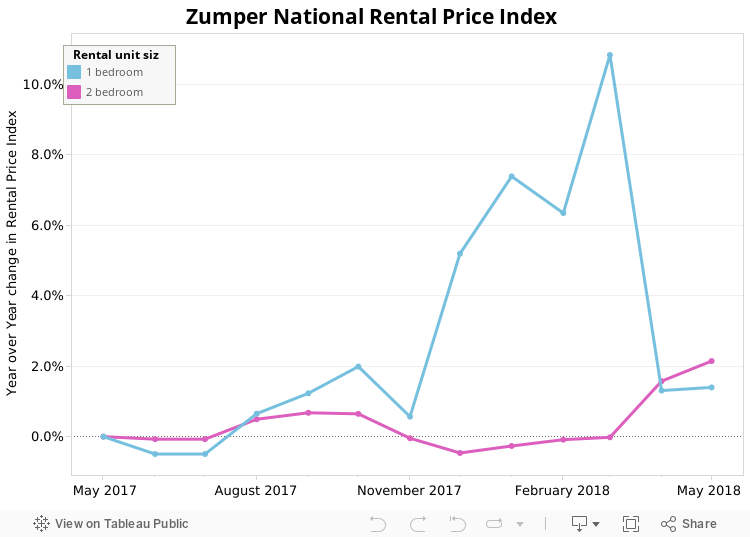
Overall, the national one bedroom rent grew 4.6% to $1,300, while two bedrooms had a smaller bump, up 0.5% to $1,398 last month. As depicted by the graph below, one bedroom rent is especially striking since it seems to be beating seasonality by a lot and is up 11.6% since this time last year.
Top Five Rental Markets
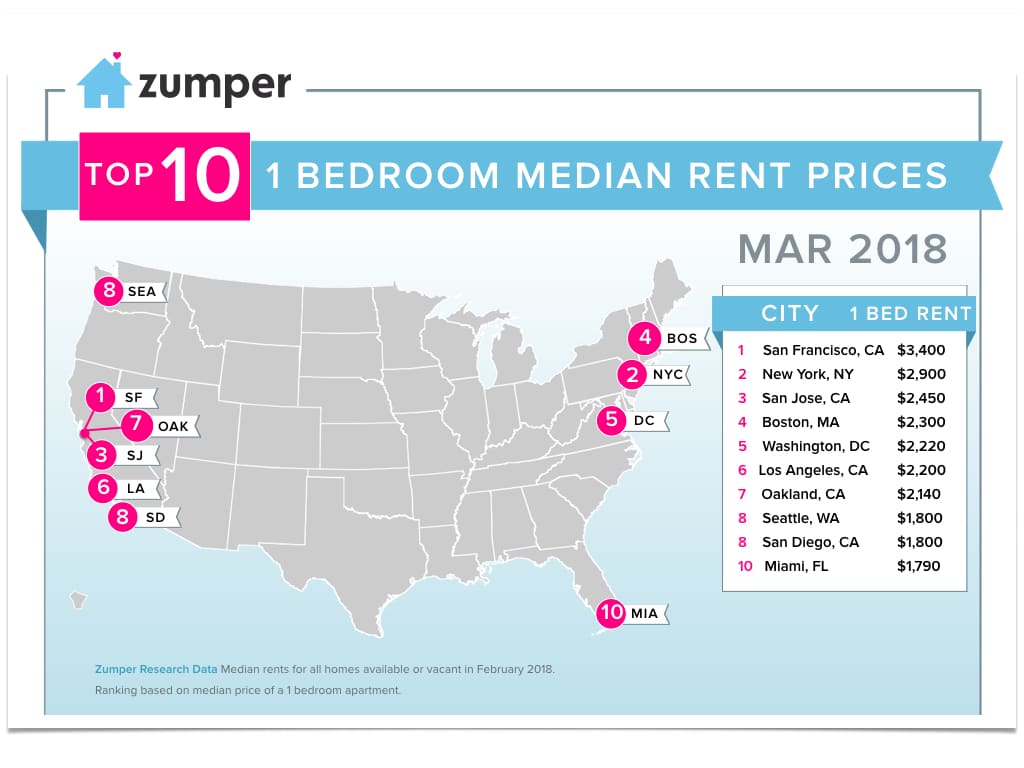
1. San Francisco, Californie continued to rank as the priciest rental market in the nation, though both one and two bedroom prices stayed flat last month at $3,400 and $4,400 respectively.
2. New York, NY saw one bedroom rent inch up 1% to $2,900, while two bedrooms had a more dramatic growth, climbing 4.9% to $3,440.
3. San Jose, CA stayed as the third most expensive city. One bedroom rent dropped a slight 0.4% to $2,450, while two bedrooms grew 1.8% to $2,830. Though fairly flat last month, one bedroom prices are up over 12% since this time last year.
4. Boston, Massachusetts, similar to San Francisco, saw a flat trend in both bedroom types. One and two bedroom rents stayed flat at $2,300 and $2,700, respectively
5. Washington, D.C. one bedroom rent dropped 2.6% to $2,220, while two bedrooms saw a larger decline, falling 4.7% to $2,810. Though on a downward trend last month, one bedroom rent in this city is up 10.4% since this time last year.
Notable Changes This Month
![]() Upward
Upward
–San Diego, CA moved up 2 spots to rank as the 8th priciest city in the nation. One bedroom rent jumped 5.3% to $1,800, making it the fastest growing in the top 10 cities, while two bedrooms remained flat at $2,250.
–Long Beach, CA climbed up past Chicago to rank as the 12th most expensive city with one bedroom rent growing 4.7% to $1,570 and two bedrooms increasing 3.6% to $2,000.
–New Orleans, LA saw one bedroom rent jump 4.8% to $1,300 and move up 3 spots to rank as 22nd. Two bedroom prices, on the other hand, took a 5% dip to $1,340.
–Houston, Texas jumped 2 spots to become the 24th priciest city with one bedroom rent growing 5% to $1,260 and two bedrooms increasing 4.7% to $1,550.
–Orlando, Floride one bedroom rent climbed 5.3%, settling at $1,190, and up four spots to rank as 30th. Two bedroom rent saw a less drastic increase, up 1.5% to $1,320.
![]() Downward
Downward
–Chicago, Illinois moved down 2 spots in our rankings to become the 14th priciest city. One bedroom rent fell 5.2% to $1,470 and two bedrooms dropped 4.8% to $1,970.
–Providence, RI fell 3 spots to rank as 19th with one bedroom rent decreasing 5% to $1,330 and two bedrooms falling 4.9% to $1,370.
–Nashville, TN saw one bedroom rent drop 3.1% to $1,250, falling 3 spots to become the 26th most expensive. Two bedrooms had a smaller decline, decreasing 2.1% to $1,370.
–Madison, WI took a whopping 7 ranking dip to become the 33rd priciest city. One bedroom rent fell 5% to $1,140, while two bedrooms dropped 1.5% to $1,300.
–Pittsburgh, PA one bedroom rent saw a 4.8% decrease, settling at an even $1,000, and a 4 ranking dip to 43rd. Two bedrooms had a downward trend as well, falling 2.4% to $1,220.
Full Data
| 1 Bedroom | 2 Bedrooms | ||||||
|---|---|---|---|---|---|---|---|
| Pos. | City | Price | M/M % | Y/Y % | Price | M/M % | Y/Y % |
| 1 | Arlington | $2,150 | 0.00% | -9.70% | $2,680 | -2.50% | -15.70% |
| 2 | Washington | $2,130 | -4.10% | 4.40% | $2,700 | -3.90% | -6.90% |
| 3 | Bethesda | $2,000 | -4.80% | -7.00% | $2,970 | -4.20% | 7.60% |
| 4 | Reston | $1,970 | -1.00% | 15.90% | $2,530 | 0.40% | 15.50% |
| 5 | Rockville | $1,730 | 1.20% | 2.40% | $2,110 | -0.50% | 0.00% |
| 6 | Alexandria | $1,660 | 1.80% | 1.80% | $1,940 | -2.50% | -1.50% |
| 7 | Silver Spring | $1,640 | -0.60% | -4.10% | $1,930 | -2.50% | -4.50% |
| 8 | Frederick | $1,190 | 5.30% | 7.20% | $1,320 | 2.30% | 4.80% |
About
The Zumper National Rent Report analyses rental data from over 1 million active listings across the United States. Data is aggregated on a monthly basis to calculate median asking rents for the top 100 metro areas by population, providing a comprehensive view of the current state of the market. The report is based on all data available in the month prior to publication.
If you’re interested in a more in-depth explanation of how and why we calculate our rent data, view our methodology post.
To keep up to date with rent changes across the country, like or follow Zumper on Facebook, Gazouillement, and Instagram. In the market for a new place? Search apartments for rent on Zumper.
Contenu associé