COVID-19 shifts demand away from the most expensive markets
Looking at monthly changes, all of the top 10 priciest cities either had flat or declining rents. It seems the pandemic has shifted the demand for apartments away from the most expensive cities, since usually demand picks up as we head into summer but now the opposite is true. As more and more companies move into remote work, many renters don’t want to pay the big city price tag when they are unable to use the amenities and are looking for more affordable options outside of large, metropolitan areas.
San Francisco rent is down over 9% year-over-year, which is the largest decline ever and the lowest price point it’s been in over 3 years.
The most expensive city in the nation experienced the largest year-over-year drop since we started creating these reports in 2015. San Francisco one-bedroom rent is down 9.2% since this time last year to $3,360, which is also the lowest price point it’s been since March 2017.
Similarly, the 3 next most expensive markets, New York City, Boston, and San Jose, all had negative year-over-year changes for their respective one-bedroom rents as well.
Both national one and two-bedroom rents on a downward trajectory
Overall, the national one-bedroom rent dropped 0.2% last month to $1,217, while two-bedrooms were flat at $1,473. On a year-to-date basis, both one and two bedroom rents are down 0.5%.
tableau
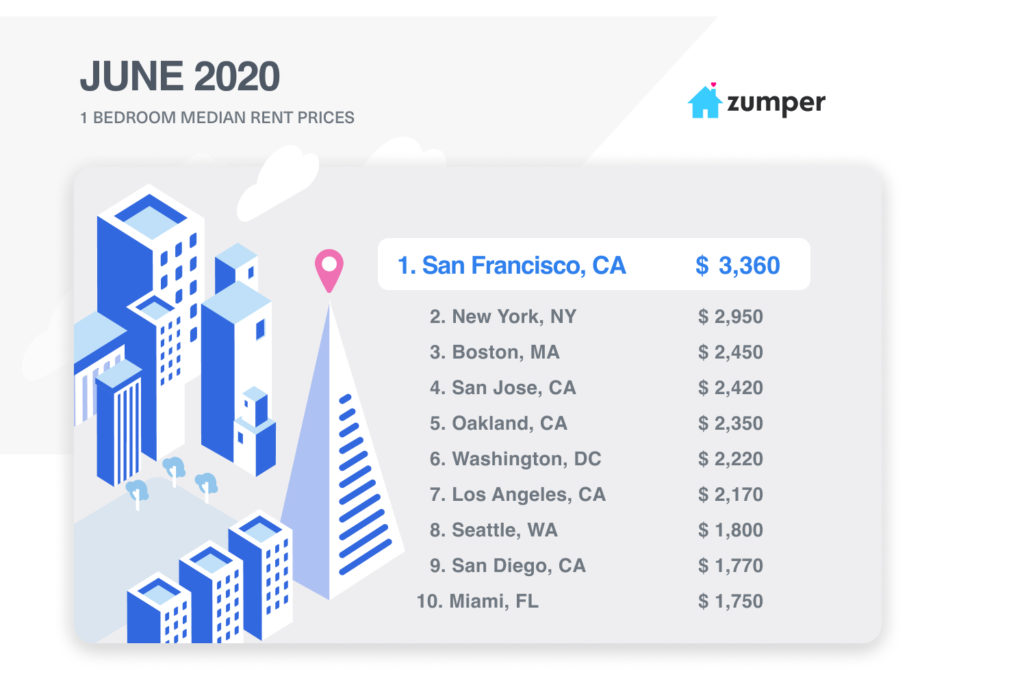
Top Five Rental Markets
1. San Francisco, Californie continued to see falling prices with one-bedroom rent dropping 2.6% to $3,360, which is the lowest price it’s been in over 3 years, while two-bedrooms decreased 1.8% to $4,420. Notably, on a year-over-year basis, one-bedroom rent is down over 9%.
2. New York, NY saw one-bedroom rent remain flat at $2,950, while two-bedrooms declined 1.2% to $3,220.
3. Boston, Massachusetts one-bedroom rent dropped 2% to $2,450, while two-bedrooms stayed flat at $2,900.
4. San Jose, CA prices also headed downward with one-bedroom rent falling 1.6% last month to $2,420, while two-bedrooms decreased 3% to $2,950.
5. Oakland, CA rounded off the top 5 markets with both one and two-bedroom rents increasing a slight 0.4% to $2,350 and $2,850, respectively.
Notable Changes This Past Month
Upward
–Providence, RI moved up 4 spots to become the 21st priciest city with one-bedroom rent jumping 5.3%, which was the largest monthly rental growth rate in the nation, to $1,400.
–Baltimore, MD saw both one and two-bedroom prices climb 5%, settling at $1,260 and $1,470, respectively, and up 5 spots to rank a the 28th most expensive.
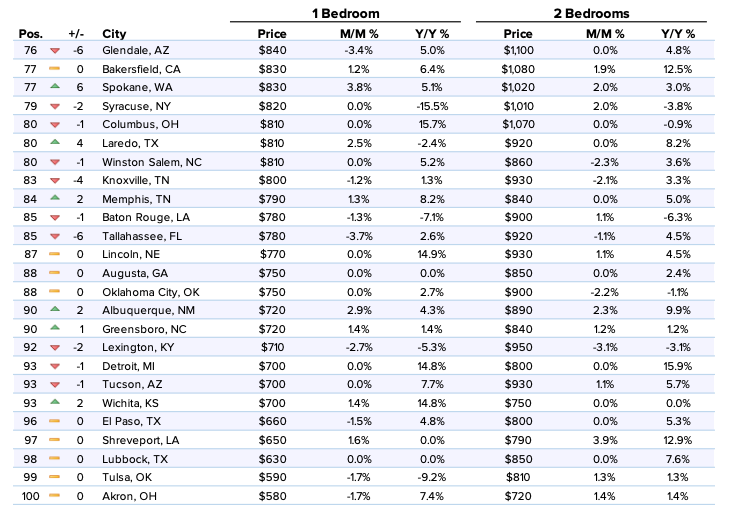
–Spokane, WA was catapulted up 6 rankings to 77th with one-bedroom rent growing 3.8% to $830 and two-bedrooms increasing 2% to $1,020.
–Tampa, Floride, climbing 4 spots to rank as the 36th priciest market, saw one-bedroom rent grow 3.6% to $1,140, while two-bedrooms increased a slight 0.7% to $1,360.
–Arlington, TX moved up 4 positions to 69th with one-bedroom rent jumping 3.5% to $880 and two-bedroom rent growing 2.7% to $1,140.
Downward
–Salt Lake City, UT dropped another 3 spots to become the 51st most expensive city with one-bedroom rent falling 4.8%, which was the largest monthly rental decline in the country, to $1,000. Two-bedrooms decreased 2.3% to $1,270.
–Milwaukee, WI saw one-bedroom rent dip 4.7%, settling at $1,010, and down 4 positions to rank as the 50th priciest market.
–Fresno, CA moved down 5 spots to 48th with one-bedroom rent dropping 4.6% to $1,040.
–Anchorage, AK took a 6 ranking plunge to 65th with one-bedroom rent falling 4.2% to $910.
–Tallahassee, FL one-bedroom rent decreased 3.7% to $780, while two-bedrooms were down 1.1% to $920. This city also dropped 6 positions to rank as the 85th most expensive market.
Full Data
| 1 Bedroom | 2 Bedrooms | ||||||
|---|---|---|---|---|---|---|---|
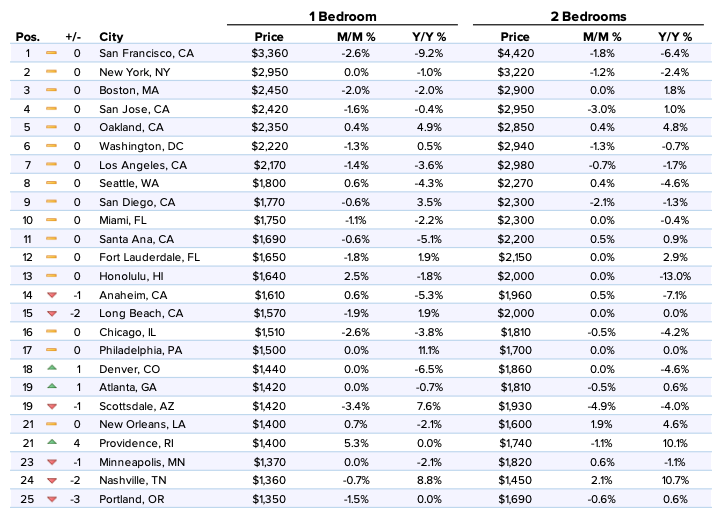
| Pos. | City | Price | M/M % | Y/Y % | Price | M/M % | Y/Y % |
| 1 | San Francisco, Californie | $3,360 | -2.60% | -9.20% | $4,420 | -1.80% | -6.40% |
| 2 | New York, NY | $2,950 | 0.00% | -1.00% | $3,220 | -1.20% | -2.40% |
| 3 | Boston, Massachusetts | $2,450 | -2.00% | -2.00% | $2,900 | 0.00% | 1.80% |
| 4 | San Jose, CA | $2,420 | -1.60% | -0.40% | $2,950 | -3.00% | 1.00% |
| 5 | Oakland, CA | $2,350 | 0.40% | 4.90% | $2,850 | 0.40% | 4.80% |
| 6 | Washington, D.C. | $2,220 | -1.30% | 0.50% | $2,940 | -1.30% | -0.70% |
| 7 | Los Angeles, Californie | $2,170 | -1.40% | -3.60% | $2,980 | -0.70% | -1.70% |
| 8 | Seattle, WA | $1,800 | 0.60% | -4.30% | $2,270 | 0.40% | -4.60% |
| 9 | San Diego, CA | $1,770 | -0.60% | 3.50% | $2,300 | -2.10% | -1.30% |
| 10 | Miami, Floride | $1,750 | -1.10% | -2.20% | $2,300 | 0.00% | -0.40% |
| 11 | Santa Ana, CA | $1,690 | -0.60% | -5.10% | $2,200 | 0.50% | 0.90% |
| 12 | Fort Lauderdale, FL | $1,650 | -1.80% | 1.90% | $2,150 | 0.00% | 2.90% |
| 13 | Honolulu, HI | $1,640 | 2.50% | -1.80% | $2,000 | 0.00% | -13.00% |
| 14 | Anaheim, CA | $1,610 | 0.60% | -5.30% | $1,960 | 0.50% | -7.10% |
| 15 | Long Beach, CA | $1,570 | -1.90% | 1.90% | $2,000 | 0.00% | 0.00% |
| 16 | Chicago, Illinois | $1,510 | -2.60% | -3.80% | $1,810 | -0.50% | -4.20% |
| 17 | Philadelphie, Pennsylvanie | $1,500 | 0.00% | 11.10% | $1,700 | 0.00% | 0.00% |
| 18 | Denver, Colorado | $1,440 | 0.00% | -6.50% | $1,860 | 0.00% | -4.60% |
| 19 | Atlanta, Géorgie | $1,420 | 0.00% | -0.70% | $1,810 | -0.50% | 0.60% |
| 19 | Scottsdale, AZ | $1,420 | -3.40% | 7.60% | $1,930 | -4.90% | -4.00% |
| 21 | New Orleans, LA | $1,400 | 0.70% | -2.10% | $1,600 | 1.90% | 4.60% |
| 21 | Providence, RI | $1,400 | 5.30% | 0.00% | $1,740 | -1.10% | 10.10% |
| 23 | Minneapolis, MN | $1,370 | 0.00% | -2.10% | $1,820 | 0.60% | -1.10% |
| 24 | Nashville, TN | $1,360 | -0.70% | 8.80% | $1,450 | 2.10% | 10.70% |
| 25 | Portland, Oregon | $1,350 | -1.50% | 0.00% | $1,690 | -0.60% | 0.60% |
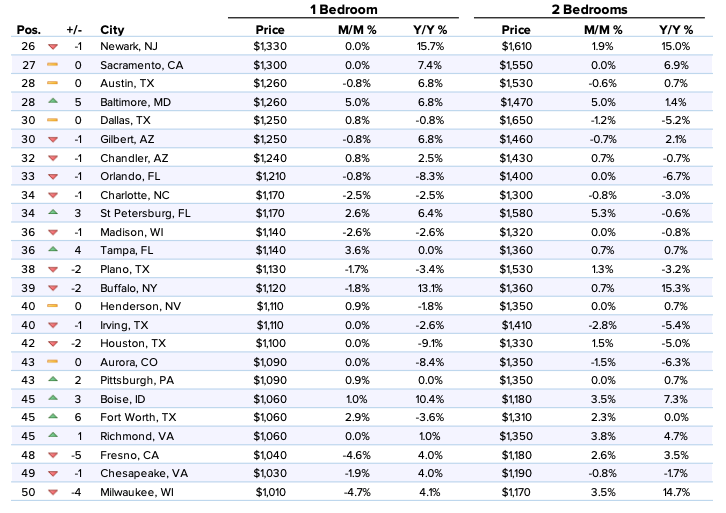
| 26 | Newark, NJ | $1,330 | 0.00% | 15.70% | $1,610 | 1.90% | 15.00% |
| 27 | Sacramento, CA | $1,300 | 0.00% | 7.40% | $1,550 | 0.00% | 6.90% |
| 28 | Austin, Texas | $1,260 | -0.80% | 6.80% | $1,530 | -0.60% | 0.70% |
| 28 | Baltimore, MD | $1,260 | 5.00% | 6.80% | $1,470 | 5.00% | 1.40% |
| 30 | Dallas, Texas | $1,250 | 0.80% | -0.80% | $1,650 | -1.20% | -5.20% |
| 30 | Gilbert, AZ | $1,250 | -0.80% | 6.80% | $1,460 | -0.70% | 2.10% |
| 32 | Chandler, AZ | $1,240 | 0.80% | 2.50% | $1,430 | 0.70% | -0.70% |
| 33 | Orlando, Floride | $1,210 | -0.80% | -8.30% | $1,400 | 0.00% | -6.70% |
| 34 | Charlotte, Caroline du Nord | $1,170 | -2.50% | -2.50% | $1,300 | -0.80% | -3.00% |
| 34 | St Petersburg, FL | $1,170 | 2.60% | 6.40% | $1,580 | 5.30% | -0.60% |
| 36 | Madison, WI | $1,140 | -2.60% | -2.60% | $1,320 | 0.00% | -0.80% |
| 36 | Tampa, Floride | $1,140 | 3.60% | 0.00% | $1,360 | 0.70% | 0.70% |
| 38 | Plano, TX | $1,130 | -1.70% | -3.40% | $1,530 | 1.30% | -3.20% |
| 39 | Buffalo, NY | $1,120 | -1.80% | 13.10% | $1,360 | 0.70% | 15.30% |
| 40 | Henderson, NV | $1,110 | 0.90% | -1.80% | $1,350 | 0.00% | 0.70% |
| 40 | Irving, TX | $1,110 | 0.00% | -2.60% | $1,410 | -2.80% | -5.40% |
| 42 | Houston, Texas | $1,100 | 0.00% | -9.10% | $1,330 | 1.50% | -5.00% |
| 43 | Aurora, CO | $1,090 | 0.00% | -8.40% | $1,350 | -1.50% | -6.30% |
| 43 | Pittsburgh, PA | $1,090 | 0.90% | 0.00% | $1,350 | 0.00% | 0.70% |
| 45 | Boise, ID | $1,060 | 1.00% | 10.40% | $1,180 | 3.50% | 7.30% |
| 45 | Fort Worth, TX | $1,060 | 2.90% | -3.60% | $1,310 | 2.30% | 0.00% |
| 45 | Richmond, VA | $1,060 | 0.00% | 1.00% | $1,350 | 3.80% | 4.70% |
| 48 | Fresno, CA | $1,040 | -4.60% | 4.00% | $1,180 | 2.60% | 3.50% |
| 49 | Chesapeake, VA | $1,030 | -1.90% | 4.00% | $1,190 | -0.80% | -1.70% |
| 50 | Milwaukee, WI | $1,010 | -4.70% | 4.10% | $1,170 | 3.50% | 14.70% |
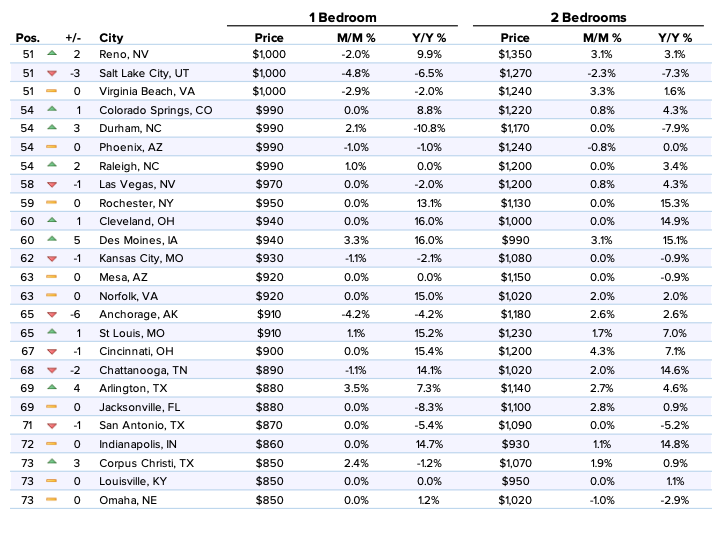
| 51 | Reno, NV | $1,000 | -2.00% | 9.90% | $1,350 | 3.10% | 3.10% |
| 51 | Salt Lake City, UT | $1,000 | -4.80% | -6.50% | $1,270 | -2.30% | -7.30% |
| 51 | Virginia Beach, VA | $1,000 | -2.90% | -2.00% | $1,240 | 3.30% | 1.60% |
| 54 | Colorado Springs, CO | $990 | 0.00% | 8.80% | $1,220 | 0.80% | 4.30% |
| 54 | Durham, NC | $990 | 2.10% | -10.80% | $1,170 | 0.00% | -7.90% |
| 54 | Phoenix, Arizona | $990 | -1.00% | -1.00% | $1,240 | -0.80% | 0.00% |
| 54 | Raleigh, NC | $990 | 1.00% | 0.00% | $1,200 | 0.00% | 3.40% |
| 58 | Las Vegas, Nevada | $970 | 0.00% | -2.00% | $1,200 | 0.80% | 4.30% |
| 59 | Rochester, NY | $950 | 0.00% | 13.10% | $1,130 | 0.00% | 15.30% |
| 60 | Cleveland, OH | $940 | 0.00% | 16.00% | $1,000 | 0.00% | 14.90% |
| 60 | Des Moines, IA | $940 | 3.30% | 16.00% | $990 | 3.10% | 15.10% |
| 62 | Kansas City, MO | $930 | -1.10% | -2.10% | $1,080 | 0.00% | -0.90% |
| 63 | Mesa, AZ | $920 | 0.00% | 0.00% | $1,150 | 0.00% | -0.90% |
| 63 | Norfolk, VA | $920 | 0.00% | 15.00% | $1,020 | 2.00% | 2.00% |
| 65 | Anchorage, AK | $910 | -4.20% | -4.20% | $1,180 | 2.60% | 2.60% |
| 65 | St Louis, MO | $910 | 1.10% | 15.20% | $1,230 | 1.70% | 7.00% |
| 67 | Cincinnati, OH | $900 | 0.00% | 15.40% | $1,200 | 4.30% | 7.10% |
| 68 | Chattanooga, TN | $890 | -1.10% | 14.10% | $1,020 | 2.00% | 14.60% |
| 69 | Arlington, TX | $880 | 3.50% | 7.30% | $1,140 | 2.70% | 4.60% |
| 69 | Jacksonville, FL | $880 | 0.00% | -8.30% | $1,100 | 2.80% | 0.90% |
| 71 | San Antonio, TX | $870 | 0.00% | -5.40% | $1,090 | 0.00% | -5.20% |
| 72 | Indianapolis, IN | $860 | 0.00% | 14.70% | $930 | 1.10% | 14.80% |
| 73 | Corpus Christi, TX | $850 | 2.40% | -1.20% | $1,070 | 1.90% | 0.90% |
| 73 | Louisville, KY | $850 | 0.00% | 0.00% | $950 | 0.00% | 1.10% |
| 73 | Omaha, NE | $850 | 0.00% | 1.20% | $1,020 | -1.00% | -2.90% |
| 76 | Glendale, AZ | $840 | -3.40% | 5.00% | $1,100 | 0.00% | 4.80% |
| 77 | Bakersfield, CA | $830 | 1.20% | 6.40% | $1,080 | 1.90% | 12.50% |
| 77 | Spokane, WA | $830 | 3.80% | 5.10% | $1,020 | 2.00% | 3.00% |
| 79 | Syracuse, NY | $820 | 0.00% | -15.50% | $1,010 | 2.00% | -3.80% |
| 80 | Columbus, Ohio | $810 | 0.00% | 15.70% | $1,070 | 0.00% | -0.90% |
| 80 | Laredo, TX | $810 | 2.50% | -2.40% | $920 | 0.00% | 8.20% |
| 80 | Winston Salem, NC | $810 | 0.00% | 5.20% | $860 | -2.30% | 3.60% |
| 83 | Knoxville, TN | $800 | -1.20% | 1.30% | $930 | -2.10% | 3.30% |
| 84 | Memphis, TN | $790 | 1.30% | 8.20% | $840 | 0.00% | 5.00% |
| 85 | Baton Rouge, LA | $780 | -1.30% | -7.10% | $900 | 1.10% | -6.30% |
| 85 | Tallahassee, FL | $780 | -3.70% | 2.60% | $920 | -1.10% | 4.50% |
| 87 | Lincoln, NE | $770 | 0.00% | 14.90% | $930 | 1.10% | 4.50% |
| 88 | Augusta, GA | $750 | 0.00% | 0.00% | $850 | 0.00% | 2.40% |
| 88 | Oklahoma City, OK | $750 | 0.00% | 2.70% | $900 | -2.20% | -1.10% |
| 90 | Albuquerque, NM | $720 | 2.90% | 4.30% | $890 | 2.30% | 9.90% |
| 90 | Greensboro, NC | $720 | 1.40% | 1.40% | $840 | 1.20% | 1.20% |
| 92 | Lexington, KY | $710 | -2.70% | -5.30% | $950 | -3.10% | -3.10% |
| 93 | Detroit, MI | $700 | 0.00% | 14.80% | $800 | 0.00% | 15.90% |
| 93 | Tucson, AZ | $700 | 0.00% | 7.70% | $930 | 1.10% | 5.70% |
| 93 | Wichita, KS | $700 | 1.40% | 14.80% | $750 | 0.00% | 0.00% |
| 96 | El Paso, TX | $660 | -1.50% | 4.80% | $800 | 0.00% | 5.30% |
| 97 | Shreveport, LA | $650 | 1.60% | 0.00% | $790 | 3.90% | 12.90% |
| 98 | Lubbock, TX | $630 | 0.00% | 0.00% | $850 | 0.00% | 7.60% |
| 99 | Tulsa, OK | $590 | -1.70% | -9.20% | $810 | 1.30% | 1.30% |
| 100 | Akron, OH | $580 | -1.70% | 7.40% | $720 | 1.40% | 1.40% |
About
The Zumper National Rent Report analyzes rental data from over 1 million active listings across the United States. Data is aggregated on a monthly basis to calculate median asking rents for the top 100 metro areas by population, providing a comprehensive view of the current state of the market. The report is based on all data available in the month prior to publication.
If you’re interested in a more in-depth explanation of how and why we calculate our rent data, view our methodology post.
To keep up to date with rent changes across the country, like or follow Zumper on Facebook, Gazouillement, and Instagram. In the market for a new place? Search apartments for rent on Zumper.
Contenu associé