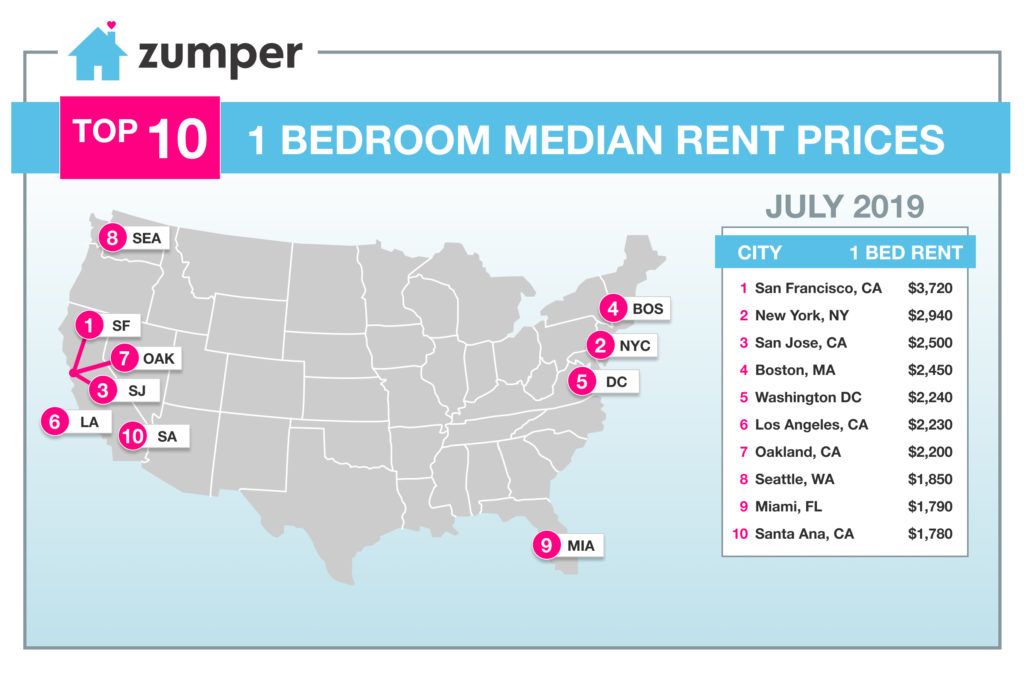
San Francisco one bedroom rent hit another peak, up $20 to $3,720, as summer moving demand starts to drive up prices in this city. New York City one bedroom rent, on the other hand, took a slight dip after hitting its 3 year peak in our last rent report. The other top 10 markets saw some adjustments as San Jose kicked down Boston to rank as the 3rd priciest city and D.C. outpaced Los Angeles to become 5th. Oakland also fell to 7th.
Notably, there are larger amounts of double digit year over year rental dips in the mid to lower tiered markets, signaling a cooling off from last year when so many saw the reverse direction.
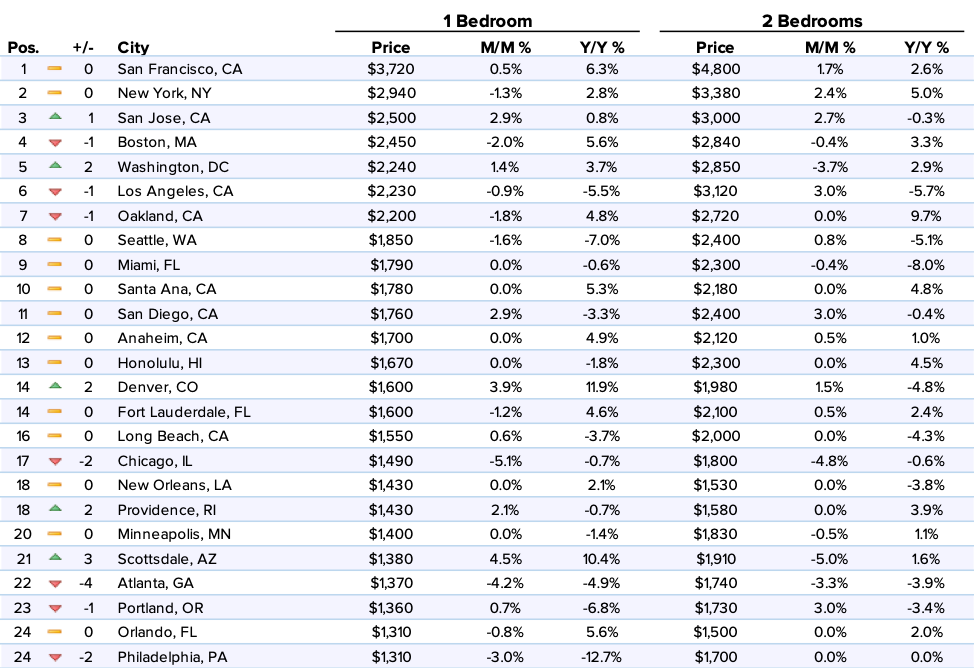
Raleigh had the fastest growing rent last month, up 5.1%, while Chicago and Bakersfield saw the largest dips, both down 5.1%.
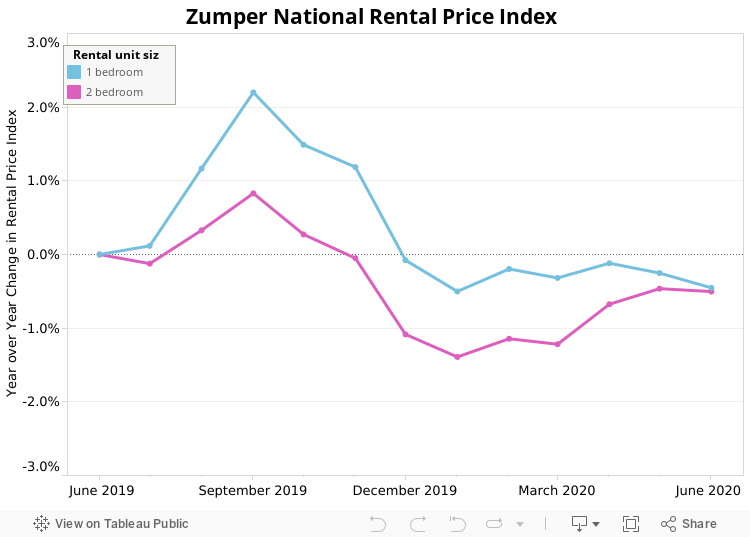
Overall, the national one bedroom rent grew 0.3% to $1,220 last month, while two bedrooms dropped 0.1% to $1,469. On a year to date basis, one and two bedrooms are up 0.8% and 1.9%, respectively.
Top Five Rental Markets
1. San Francisco, Californie, as we get into the hot moving season, saw one bedroom rent inch up $20 last month to hit a new peak of $3,720. Two bedrooms also grew, up 1.7% to $4,800.
2. New York, NY one bedroom rent fell from its 3 year high in our previous report, dropping 1.3% to $2,940. Two bedrooms, on the other hand, grew 2.4% to $3,380.
3. San Jose, CA moved up a spot, outpacing Boston, to become the 3rd most expensive rental market in the nation. One bedroom rent grew 2.9% to $2,500, while two bedrooms decreased a slight 0.4% to $2,840.
4. Boston, Massachusetts dropped down to 4th with one bedroom rent falling 2% to $2,450 and two bedrooms decreasing 0.4% to $2,840.
5. Washington, D.C. moved up 2 spots, and into the top 5 markets, with one bedroom rent up 1.4% to $2,240. Two bedrooms saw a 3.7% decline to $2,850.
Notable Changes This Month
Upward
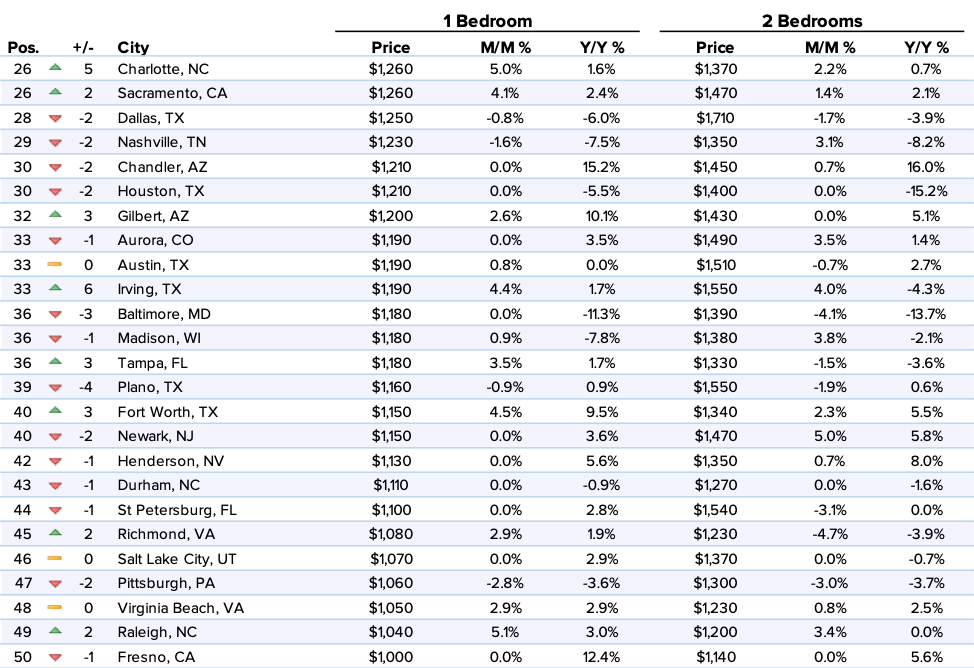
–Raleigh, NC saw one bedroom rent climb 5.1%, which was the largest monthly rental growth rate in the nation, to $1,040. This large bump moved the city up 2 positions to become 49th most expensive rental market.
–Charlotte, Caroline du Nord took a 5 ranking bump up to 26th with one bedroom rent climbing 5% to $1,260 and two bedrooms increasing 2.2% to $1,370.
–Glendale, AZ jumped up 7 spots to rank as the 67th most expensive city. One bedroom rent grew 5% to $840, while two bedrooms were up 1.9% to $1,070.
–Scottsdale, AZ saw one bedroom rent climb 4.5%, settling at $1,380, and up 3 positions to become the 21st priciest city.
–Fort Worth, TX moved up 3 spots to rank as 40th with one bedroom rent jumping 4.5% to $1,150 and two bedrooms increasing 2.3% to $1,340.
Downward
–Chicago, Illinois fell 2 spots to rank as the 17th priciest city with one bedroom rent dropping 5.1%, which is tied with Bakersfield’s growth rate as the largest dip in the nation, to $1,490.
–Bakersfield, CA saw one bedroom rent drop 5.1%, settling at $740, and down 7 positions to become 86th.
–Anchorage, AK moved down 3 spots to 62nd with one bedroom rent falling 4.2% to $910. Two bedrooms, on the other hand, were flat at $1,150.
–Atlanta, Géorgie took a 4 ranking dip to 22nd with one bedroom rent decreasing 4.2% to $1,370 and two bedrooms down 3.3% to $1,740.
–Philadelphie, Pennsylvanie one bedroom rent dropped 3%, settling at $1,310, and down 2 spots to rank as the 24th priciest city. Two bedrooms stayed stable at $1,700.
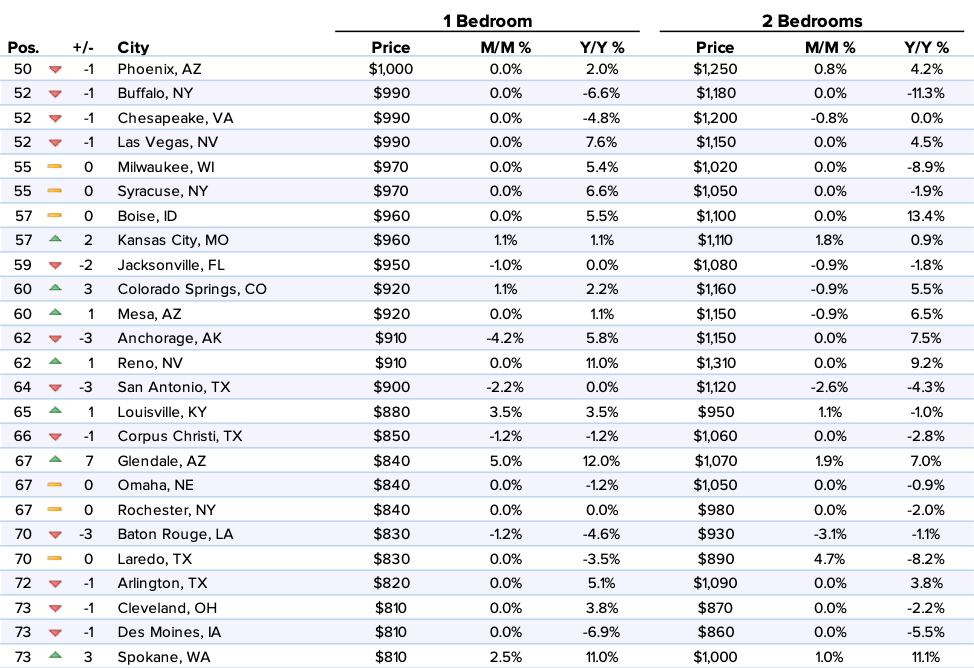
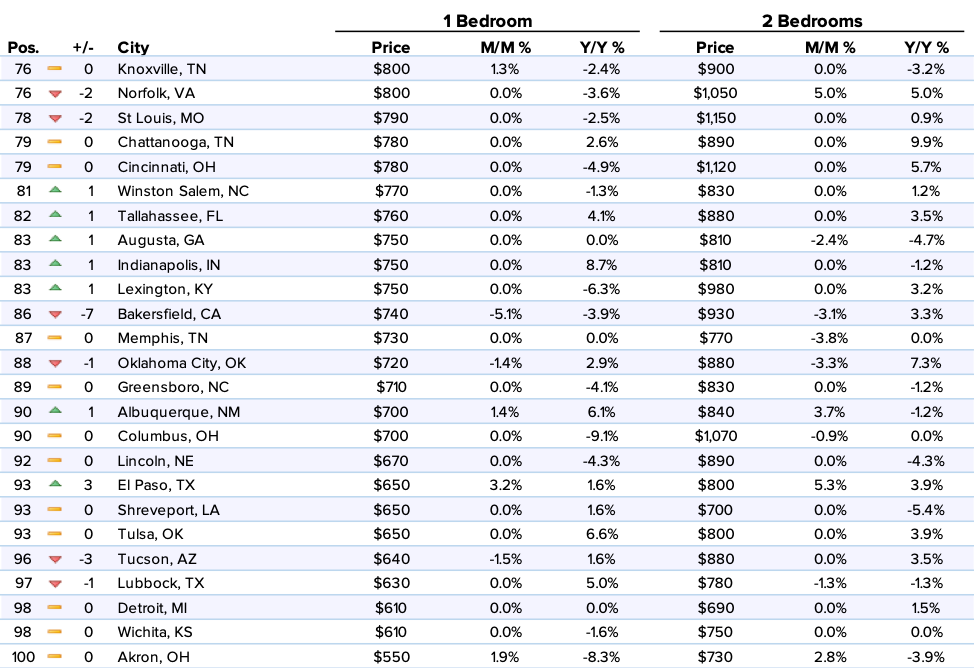
Full Data
| 1 Bedroom | 2 Bedrooms | ||||||
|---|---|---|---|---|---|---|---|
| Pos. | City | Price | M/M % | Y/Y % | Price | M/M % | Y/Y % |
| 1 | San Francisco, Californie | $3,720 | 0.50% | 6.30% | $4,800 | 1.70% | 2.60% |
| 2 | New York, NY | $2,940 | -1.30% | 2.80% | $3,380 | 2.40% | 5.00% |
| 3 | San Jose, CA | $2,500 | 2.90% | 0.80% | $3,000 | 2.70% | -0.30% |
| 4 | Boston, Massachusetts | $2,450 | -2.00% | 5.60% | $2,840 | -0.40% | 3.30% |
| 5 | Washington, D.C. | $2,240 | 1.40% | 3.70% | $2,850 | -3.70% | 2.90% |
| 6 | Los Angeles, Californie | $2,230 | -0.90% | -5.50% | $3,120 | 3.00% | -5.70% |
| 7 | Oakland, CA | $2,200 | -1.80% | 4.80% | $2,720 | 0.00% | 9.70% |
| 8 | Seattle, WA | $1,850 | -1.60% | -7.00% | $2,400 | 0.80% | -5.10% |
| 9 | Miami, Floride | $1,790 | 0.00% | -0.60% | $2,300 | -0.40% | -8.00% |
| 10 | Santa Ana, CA | $1,780 | 0.00% | 5.30% | $2,180 | 0.00% | 4.80% |
| 11 | San Diego, CA | $1,760 | 2.90% | -3.30% | $2,400 | 3.00% | -0.40% |
| 12 | Anaheim, CA | $1,700 | 0.00% | 4.90% | $2,120 | 0.50% | 1.00% |
| 13 | Honolulu, HI | $1,670 | 0.00% | -1.80% | $2,300 | 0.00% | 4.50% |
| 14 | Denver, Colorado | $1,600 | 3.90% | 11.90% | $1,980 | 1.50% | -4.80% |
| 14 | Fort Lauderdale, FL | $1,600 | -1.20% | 4.60% | $2,100 | 0.50% | 2.40% |
| 16 | Long Beach, CA | $1,550 | 0.60% | -3.70% | $2,000 | 0.00% | -4.30% |
| 17 | Chicago, Illinois | $1,490 | -5.10% | -0.70% | $1,800 | -4.80% | -0.60% |
| 18 | New Orleans, LA | $1,430 | 0.00% | 2.10% | $1,530 | 0.00% | -3.80% |
| 18 | Providence, RI | $1,430 | 2.10% | -0.70% | $1,580 | 0.00% | 3.90% |
| 20 | Minneapolis, MN | $1,400 | 0.00% | -1.40% | $1,830 | -0.50% | 1.10% |
| 21 | Scottsdale, AZ | $1,380 | 4.50% | 10.40% | $1,910 | -5.00% | 1.60% |
| 22 | Atlanta, Géorgie | $1,370 | -4.20% | -4.90% | $1,740 | -3.30% | -3.90% |
| 23 | Portland, Oregon | $1,360 | 0.70% | -6.80% | $1,730 | 3.00% | -3.40% |
| 24 | Orlando, Floride | $1,310 | -0.80% | 5.60% | $1,500 | 0.00% | 2.00% |
| 24 | Philadelphie, Pennsylvanie | $1,310 | -3.00% | -12.70% | $1,700 | 0.00% | 0.00% |
| 26 | Charlotte, Caroline du Nord | $1,260 | 5.00% | 1.60% | $1,370 | 2.20% | 0.70% |
| 26 | Sacramento, CA | $1,260 | 4.10% | 2.40% | $1,470 | 1.40% | 2.10% |
| 28 | Dallas, Texas | $1,250 | -0.80% | -6.00% | $1,710 | -1.70% | -3.90% |
| 29 | Nashville, TN | $1,230 | -1.60% | -7.50% | $1,350 | 3.10% | -8.20% |
| 30 | Chandler, AZ | $1,210 | 0.00% | 15.20% | $1,450 | 0.70% | 16.00% |
| 30 | Houston, Texas | $1,210 | 0.00% | -5.50% | $1,400 | 0.00% | -15.20% |
| 32 | Gilbert, AZ | $1,200 | 2.60% | 10.10% | $1,430 | 0.00% | 5.10% |
| 33 | Aurora, CO | $1,190 | 0.00% | 3.50% | $1,490 | 3.50% | 1.40% |
| 33 | Austin, Texas | $1,190 | 0.80% | 0.00% | $1,510 | -0.70% | 2.70% |
| 33 | Irving, TX | $1,190 | 4.40% | 1.70% | $1,550 | 4.00% | -4.30% |
| 36 | Baltimore, MD | $1,180 | 0.00% | -11.30% | $1,390 | -4.10% | -13.70% |
| 36 | Madison, WI | $1,180 | 0.90% | -7.80% | $1,380 | 3.80% | -2.10% |
| 36 | Tampa, Floride | $1,180 | 3.50% | 1.70% | $1,330 | -1.50% | -3.60% |
| 39 | Plano, TX | $1,160 | -0.90% | 0.90% | $1,550 | -1.90% | 0.60% |
| 40 | Fort Worth, TX | $1,150 | 4.50% | 9.50% | $1,340 | 2.30% | 5.50% |
| 40 | Newark, NJ | $1,150 | 0.00% | 3.60% | $1,470 | 5.00% | 5.80% |
| 42 | Henderson, NV | $1,130 | 0.00% | 5.60% | $1,350 | 0.70% | 8.00% |
| 43 | Durham, NC | $1,110 | 0.00% | -0.90% | $1,270 | 0.00% | -1.60% |
| 44 | St Petersburg, FL | $1,100 | 0.00% | 2.80% | $1,540 | -3.10% | 0.00% |
| 45 | Richmond, VA | $1,080 | 2.90% | 1.90% | $1,230 | -4.70% | -3.90% |
| 46 | Salt Lake City, UT | $1,070 | 0.00% | 2.90% | $1,370 | 0.00% | -0.70% |
| 47 | Pittsburgh, PA | $1,060 | -2.80% | -3.60% | $1,300 | -3.00% | -3.70% |
| 48 | Virginia Beach, VA | $1,050 | 2.90% | 2.90% | $1,230 | 0.80% | 2.50% |
| 49 | Raleigh, NC | $1,040 | 5.10% | 3.00% | $1,200 | 3.40% | 0.00% |
| 50 | Fresno, CA | $1,000 | 0.00% | 12.40% | $1,140 | 0.00% | 5.60% |
| 50 | Phoenix, Arizona | $1,000 | 0.00% | 2.00% | $1,250 | 0.80% | 4.20% |
| 52 | Buffalo, NY | $990 | 0.00% | -6.60% | $1,180 | 0.00% | -11.30% |
| 52 | Chesapeake, VA | $990 | 0.00% | -4.80% | $1,200 | -0.80% | 0.00% |
| 52 | Las Vegas, Nevada | $990 | 0.00% | 7.60% | $1,150 | 0.00% | 4.50% |
| 55 | Milwaukee, WI | $970 | 0.00% | 5.40% | $1,020 | 0.00% | -8.90% |
| 55 | Syracuse, NY | $970 | 0.00% | 6.60% | $1,050 | 0.00% | -1.90% |
| 57 | Boise, ID | $960 | 0.00% | 5.50% | $1,100 | 0.00% | 13.40% |
| 57 | Kansas City, MO | $960 | 1.10% | 1.10% | $1,110 | 1.80% | 0.90% |
| 59 | Jacksonville, FL | $950 | -1.00% | 0.00% | $1,080 | -0.90% | -1.80% |
| 60 | Colorado Springs, CO | $920 | 1.10% | 2.20% | $1,160 | -0.90% | 5.50% |
| 60 | Mesa, AZ | $920 | 0.00% | 1.10% | $1,150 | -0.90% | 6.50% |
| 62 | Anchorage, AK | $910 | -4.20% | 5.80% | $1,150 | 0.00% | 7.50% |
| 62 | Reno, NV | $910 | 0.00% | 11.00% | $1,310 | 0.00% | 9.20% |
| 64 | San Antonio, TX | $900 | -2.20% | 0.00% | $1,120 | -2.60% | -4.30% |
| 65 | Louisville, KY | $880 | 3.50% | 3.50% | $950 | 1.10% | -1.00% |
| 66 | Corpus Christi, TX | $850 | -1.20% | -1.20% | $1,060 | 0.00% | -2.80% |
| 67 | Glendale, AZ | $840 | 5.00% | 12.00% | $1,070 | 1.90% | 7.00% |
| 67 | Omaha, NE | $840 | 0.00% | -1.20% | $1,050 | 0.00% | -0.90% |
| 67 | Rochester, NY | $840 | 0.00% | 0.00% | $980 | 0.00% | -2.00% |
| 70 | Baton Rouge, LA | $830 | -1.20% | -4.60% | $930 | -3.10% | -1.10% |
| 70 | Laredo, TX | $830 | 0.00% | -3.50% | $890 | 4.70% | -8.20% |
| 72 | Arlington, TX | $820 | 0.00% | 5.10% | $1,090 | 0.00% | 3.80% |
| 73 | Cleveland, OH | $810 | 0.00% | 3.80% | $870 | 0.00% | -2.20% |
| 73 | Des Moines, IA | $810 | 0.00% | -6.90% | $860 | 0.00% | -5.50% |
| 73 | Spokane, WA | $810 | 2.50% | 11.00% | $1,000 | 1.00% | 11.10% |
| 76 | Knoxville, TN | $800 | 1.30% | -2.40% | $900 | 0.00% | -3.20% |
| 76 | Norfolk, VA | $800 | 0.00% | -3.60% | $1,050 | 5.00% | 5.00% |
| 78 | St Louis, MO | $790 | 0.00% | -2.50% | $1,150 | 0.00% | 0.90% |
| 79 | Chattanooga, TN | $780 | 0.00% | 2.60% | $890 | 0.00% | 9.90% |
| 79 | Cincinnati, OH | $780 | 0.00% | -4.90% | $1,120 | 0.00% | 5.70% |
| 81 | Winston Salem, NC | $770 | 0.00% | -1.30% | $830 | 0.00% | 1.20% |
| 82 | Tallahassee, FL | $760 | 0.00% | 4.10% | $880 | 0.00% | 3.50% |
| 83 | Augusta, GA | $750 | 0.00% | 0.00% | $810 | -2.40% | -4.70% |
| 83 | Indianapolis, IN | $750 | 0.00% | 8.70% | $810 | 0.00% | -1.20% |
| 83 | Lexington, KY | $750 | 0.00% | -6.30% | $980 | 0.00% | 3.20% |
| 86 | Bakersfield, CA | $740 | -5.10% | -3.90% | $930 | -3.10% | 3.30% |
| 87 | Memphis, TN | $730 | 0.00% | 0.00% | $770 | -3.80% | 0.00% |
| 88 | Oklahoma City, OK | $720 | -1.40% | 2.90% | $880 | -3.30% | 7.30% |
| 89 | Greensboro, NC | $710 | 0.00% | -4.10% | $830 | 0.00% | -1.20% |
| 90 | Albuquerque, NM | $700 | 1.40% | 6.10% | $840 | 3.70% | -1.20% |
| 90 | Columbus, Ohio | $700 | 0.00% | -9.10% | $1,070 | -0.90% | 0.00% |
| 92 | Lincoln, NE | $670 | 0.00% | -4.30% | $890 | 0.00% | -4.30% |
| 93 | El Paso, TX | $650 | 3.20% | 1.60% | $800 | 5.30% | 3.90% |
| 93 | Shreveport, LA | $650 | 0.00% | 1.60% | $700 | 0.00% | -5.40% |
| 93 | Tulsa, OK | $650 | 0.00% | 6.60% | $800 | 0.00% | 3.90% |
| 96 | Tucson, AZ | $640 | -1.50% | 1.60% | $880 | 0.00% | 3.50% |
| 97 | Lubbock, TX | $630 | 0.00% | 5.00% | $780 | -1.30% | -1.30% |
| 98 | Detroit, MI | $610 | 0.00% | 0.00% | $690 | 0.00% | 1.50% |
| 98 | Wichita, KS | $610 | 0.00% | -1.60% | $750 | 0.00% | 0.00% |
| 100 | Akron, OH | $550 | 1.90% | -8.30% | $730 | 2.80% | -3.90% |
About
The Zumper National Rent Report analyses rental data from over 1 million active listings across the United States. Data is aggregated on a monthly basis to calculate median asking rents for the top 100 metro areas by population, providing a comprehensive view of the current state of the market. The report is based on all data available in the month prior to publication.
If you’re interested in a more in-depth explanation of how and why we calculate our rent data, view our methodology post.
To keep up to date with rent changes across the country, like or follow Zumper on Facebook, Gazouillement, and Instagram. In the market for a new place? Search apartments for renton Zumper.
Contenu associé