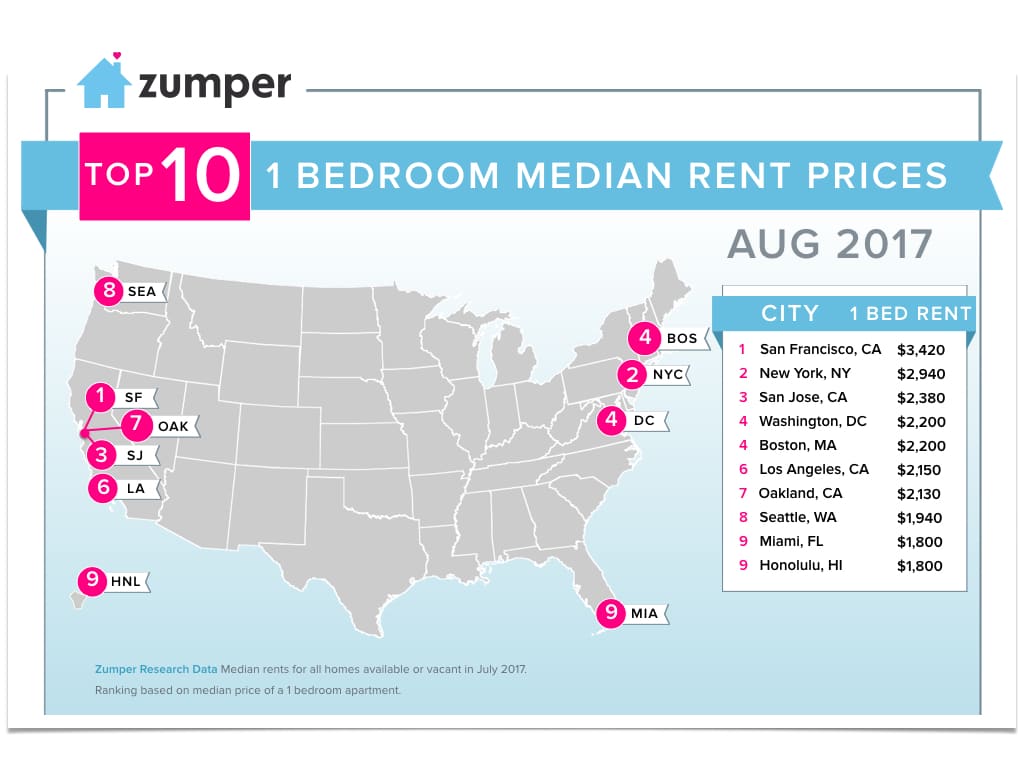
August’s edition of Zumper’s National Rent Report experienced mixed changes across the nation’s top 100 rental markets. While the top 10 rental markets experienced little change, which is surprising since we are well into the hot, moving summer months, the mid and lower tier markets were more volatile. Overall, the Zumper National Rent Index showed that one bedroom median rent increased by 1.2% to $1,176, while two bedroom median rent increased a slight 0.6% to $1,399.

1. San Francisco, Californie remained at the top of the list in this month’s report. The median rent for one-bedroom units decreased by 0.9% to $3,420, while two-bedroom units remained flat at $4,500.
2. New York, NY, ranking as the second most expensive city to rent, saw slightly decreasing prices this month. Rent for one-bedroom units dropped by 0.3% to $2,940, while the median rent for two-bedroom units fell 1.5% to $3,300.
3. San Jose, CA also experienced a small decline in rent prices, by 0.4% for both one and two-bedroom units. Median rents became $2,380 and $2,830, respectively. Rent for one-bedroom units is up by 7.2% compared to this time last year.
4. Washington, D.C. and Boston, Massachusetts were tied this month, ranking as fourth. Rent for one-bedroom units was $2,200 for both cities. Two-bedroom rent climbed 0.8% to $2,650 in Boston, while it dropped by 4.3% to $3,150 in Washington.
5. Los Angeles, Californie’s one-bedroom rent grew 2.4% to $2,150. Rent for two-bedroom apartments was also up, by 3.3% to $3,100. Compared to this time last year, one-bedroom prices were up by 8%.
Notable Changes This June
![]() Upward
Upward
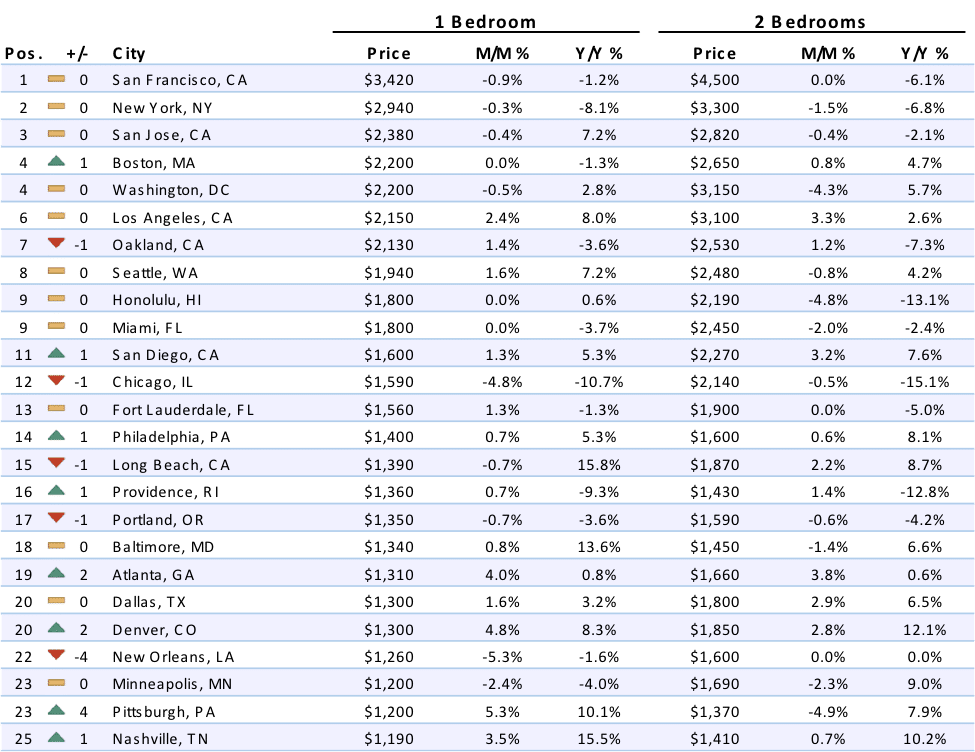
– Pittsburgh, PA moved up by 4 spots, ranking as the 23rd priciest market this month. Median rent jumped 5.3% to $1,200 for one-bedroom units, while two-bedroom prices were down by 4.9% to $1,370. Year-over-year changes in median rent prices were -10.1% and +7.9% for one-bedroom and two-bedroom apartments, respectively.
– Denver, Colorado saw a month of rapid growth, moving up two spots this month. Rent for one-bedroom units was up by 4.8% to $1,300, and similarly, the median rent for two-bedroom units also increased, by 2.8% to $1,850.
– Irving, TX rose four spots, ranking as the 27th priciest city with median rents at $1,150 and $1,420, for one and two-bedroom units, respectively. Yearly growth rates were at 15% and 10.2%.
– Plano, TX‘s one-bedroom prices jumped by 4.6% to $1,130, ranking as the 30th most expensive. Two bedroom rent rose 2.8% to $1,490.
– Gilbert, AZ also experienced rapid growth in one-bedroom rent, climbing up 5.1% to $1,040 this month.
![]() Downward
Downward
– New Orleans, LA saw a 5.3% decline in one-bedroom rent, moving down four spots to 22nd. The median rents for one and two-bedroom units were $1,260 and $1,600, respectively.
– Sacramento, CA fell four spots this month, now tied with Houston, as the 31st most expensive market. The median rents for one and two-bedroom units were $1,120 and $1,240, respectively. However, the yearly growth rates for both bedroom types were 15.5% and 15.9%, showing tremendous jumps compared to this time last year.
– Scottsdale, AZ moved down 3 spots to 27th. The city saw a 4.2% decline in rent prices for one-bedroom units, dropping to $1,150. Median rent for two-bedroom units, on the other hand, remained flat at $2,000.
– Chicago, Illinois fell one spot to 12th. The median rent for one-bedroom units was $1,590, down 4.8%, and for two-bedroom units was $2,140, down 0.5%. Compared to this time last year, the median rents were down by 10.7% and 15.1% for one and two-bedroom units.
– St. Petersburg, FL dropped two spots, ranking as 48th after one-bedroom prices dropped 5.3% to $900. Similarly, two-bedroom rent was down as well, by 2.8% to $1,390.
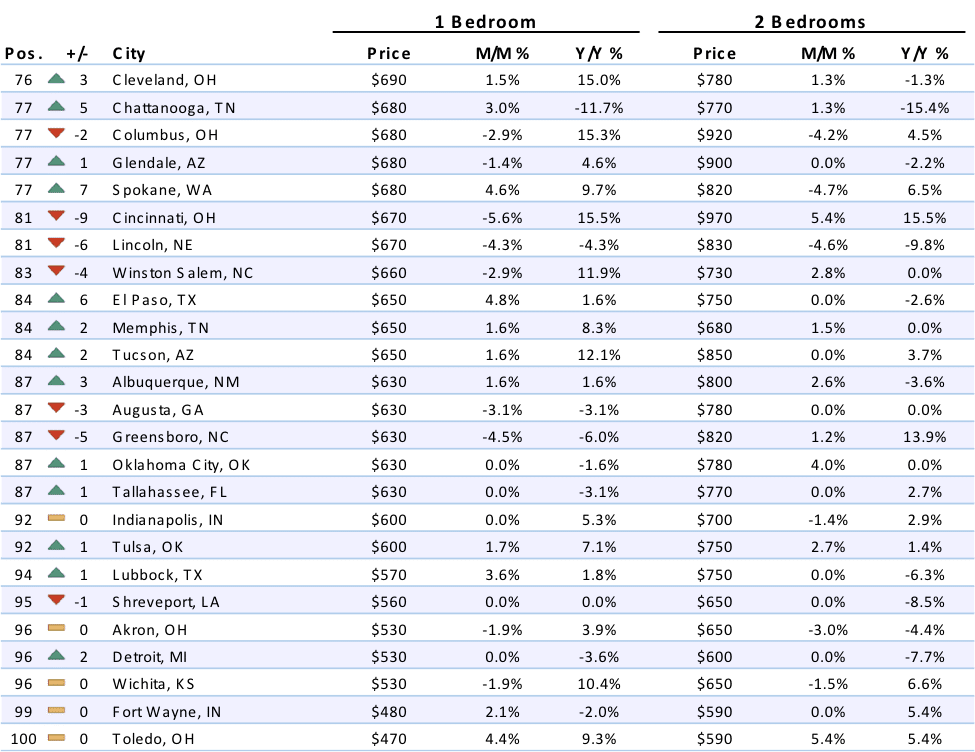
Full Data
| One Bedroom | Two Bedrooms | ||||||
|---|---|---|---|---|---|---|---|
| Pos. | City | Price | M/M % | Y/Y % | Price | M/M % | Y/Y % |
| 1 | San Francisco | $3,420 | -0.90% | -1.20% | $4,500 | 0.00% | -6.10% |
| 2 | Mountain View | $3,210 | 4.90% | 0.60% | $3,810 | 1.60% | 6.40% |
| 3 | Redwood City | $3,090 | 4.00% | -7.50% | $3,750 | 2.70% | -7.60% |
| 4 | Palo Alto | $2,860 | 5.10% | -4.30% | $4,240 | -3.60% | 2.70% |
| 5 | Emeryville | $2,740 | 1.90% | -2.80% | $3,590 | -3.00% | -5.00% |
| 6 | Sunnyvale | $2,710 | 1.10% | 0.40% | $3,200 | -3.90% | -6.40% |
| 7 | San Mateo | $2,540 | -2.70% | -0.40% | $3,470 | 0.30% | -0.60% |
| 8 | Santa Clara | $2,510 | -1.60% | 0.80% | $2,970 | -2.30% | -7.50% |
| 9 | Berkeley | $2,490 | -0.40% | -9.80% | $3,300 | -4.90% | -6.50% |
| 10 | Burlingame | $2,420 | 3.00% | -13.60% | $3,140 | 1.30% | -6.50% |
| 11 | San Jose | $2,380 | -0.40% | 7.20% | $2,820 | -0.40% | -2.10% |
| 12 | Milpitas | $2,370 | -2.10% | 3.50% | $2,820 | 2.90% | -0.70% |
| 13 | South San Francisco | $2,290 | -5.00% | -14.20% | $3,400 | 0.00% | 1.20% |
| 14 | Daly City | $2,280 | 0.40% | 6.00% | $2,900 | -2.40% | -4.90% |
| 15 | Pleasanton | $2,250 | 5.10% | 4.70% | $2,600 | 2.00% | -1.50% |
| 16 | Fremont | $2,200 | 0.00% | 0.00% | $2,540 | -0.80% | -2.30% |
| 17 | Union City | $2,170 | -1.80% | 0.50% | $2,490 | -0.80% | -8.50% |
| 17 | Walnut Creek | $2,170 | -4.00% | 0.00% | $2,700 | -0.40% | 1.90% |
| 18 | Oakland | $2,130 | 1.40% | -3.60% | $2,530 | 1.20% | -7.30% |
| 19 | Petaluma | $2,100 | 1.90% | 14.10% | $2,360 | -4.80% | 0.40% |
| 19 | San Ramon | $2,100 | 1.00% | 0.00% | $2,520 | -2.70% | 5.00% |
| 20 | San Leandro | $1,960 | 4.80% | 15.30% | $2,230 | -3.50% | 10.40% |
| 21 | Alameda | $1,950 | 2.60% | -10.60% | $2,730 | 5.00% | -15.70% |
| 22 | Hayward | $1,860 | -0.50% | -2.60% | $2,250 | 0.00% | -1.30% |
| 23 | Richmond | $1,800 | -0.60% | -9.50% | $2,140 | 0.00% | -4.50% |
| 24 | Livermore | $1,610 | -4.70% | -11.50% | $2,260 | -0.40% | 5.10% |
| 25 | Concord | $1,600 | 0.00% | 2.60% | $1,850 | 0.00% | -2.60% |
| 25 | Napa | $1,600 | 3.90% | 5.30% | $2,160 | -4.80% | 8.00% |
| 26 | Santa Rosa | $1,550 | 0.00% | 6.90% | $1,940 | -2.50% | -0.50% |
| 27 | Vallejo | $1,300 | 2.40% | 5.70% | $1,620 | 1.30% | 14.90% |
About
The Zumper National Rent Report analyses rental data from over 1 million active listings across the United States. Data is aggregated on a monthly basis to calculate median asking rents for the top 100 metro areas by population, providing a comprehensive view of the current state of the market. The report is based on all data available in the month prior to publication.
To keep up to date with rent changes across the country, like or follow Zumper on Facebook, Gazouillement, and Instagram. In the market for a new place? Search apartments for rent on Zumper.
Contenu associé