COVID-19 Real Estate Trends
COVID-19 is impacting the real estate market so we wanted to use this month’s rent report to share some data points and insights on what rental trends we are seeing in reaction to this outbreak in addition to the usual national rent prices.
As people all across the country have increasingly sheltered in place, there has naturally been a slow-down in the rental market. Google search volumes for apartments for rent were down between 10%-35% last week in our top cities. Our long-term inventory dropped by about 12% last week, driven by a couple of factors. Landlords in Shelter-in-Place states have removed their listings until a time when they can show them again and tenants are cancelling their move outs and landlords are taking these planned vacancies off the market.
Meanwhile, the number of short-term properties, which we define as a minimum lease of less than four months or an option for month to month, have grown about 20-25% year-over-year. It seems short-term property owners originally renting out to traveling guests are now marketing their properties to longer term flexi-stays in response to the collapse in demand from travelers.*
Though renters have hit a pause on their moves right now, as no one is going to open houses, we have an optimistic view for the long-term as the rental market will not be impacted as deeply as industries like travel and hospitality. The rental market tends to be quite countercyclical so in the event of an economic slowdown, the rental market has historically performed well as landlords spend to maintain their rent rolls and as Americans choose to rent not buy.
While it is still too early to see the full effects of COVID-19 on rent prices overall, since it really transformed the U.S. markets part of the way through March, there were still some notable changes in this report. In the top 10 cities, Seattle had the largest year-over-year decline with one-bedroom rent falling 8.5%. At the same time, the markets with the biggest monthly rent declines, all down around 5%, were mainly east coast hot spots and included New York City, Washington, D.C, Rochester, NY, and Richmond, VA.
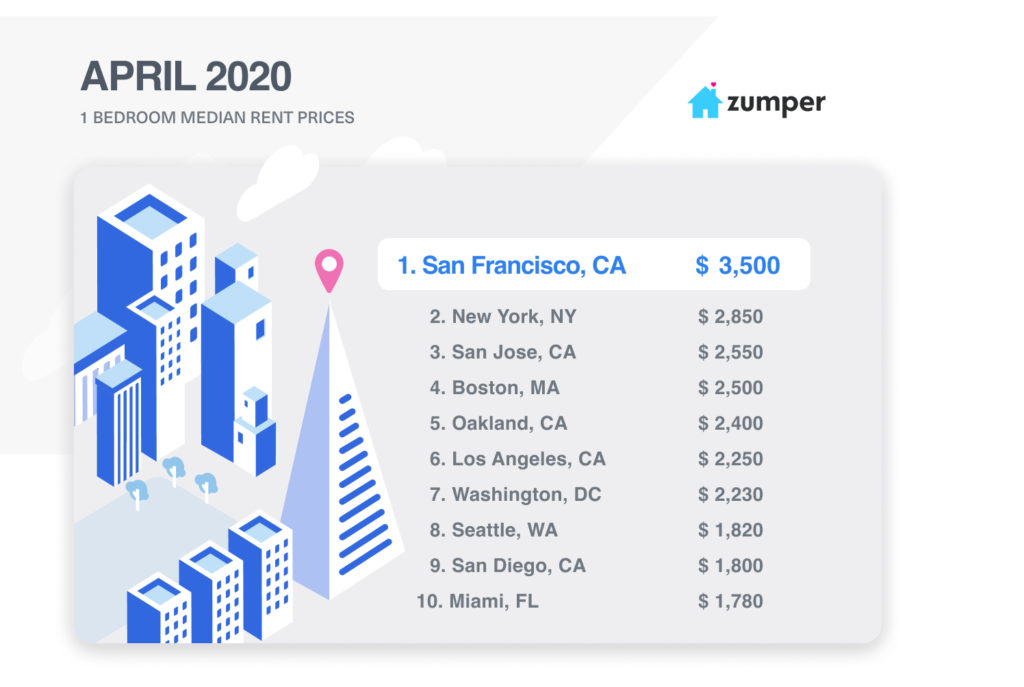
Overall, the national one bedroom rent increased 0.2% to a median of $1,221 last month, while two bedrooms grew 0.6% to $1,471. On a year-to-date basis, one and two bedroom prices are up 0.4% and 1.1%, respectively.
Top Five Rental Markets
1. San Francisco, Californie continued to rank as the most expensive market though one bedroom rent stayed flat at $3,500 and two bedrooms dropped 0.9% to $4,540. On a year over year basis, one bedroom rent is down 5.4%.
2. New York, NY saw one bedroom rent drop 5% to $2,850, while two bedrooms decreased 3.6% to $3,200.
3. San Jose, CA moved up one spot to become the 3rd most expensive city. One bedroom rent grew 3.2% to $2,550, while two bedrooms inched up 0.3% to $3,030.
4. Boston, Massachusetts fell one position to rank as the 4th priciest with one and two bedroom rents settling at $2,500 and $2,900, respectively.
5. Oakland, CA remained the 5th most expensive city with one bedroom rent increasing 1.3% to $2,400 and two bedrooms growing 3.1% to $2,990.
Notable Changes This Past Month
Upward
–Laredo, TX saw one bedroom rent climb 5.6%, which was the largest monthly growth rate in the nation, to $750 and up 2 spots to rank as the 89th priciest city. Two bedroom rent had a more modest growth rate, increasing 2.1% to $960.
–Baton Rouge, LA was catapulted up 5 positions to become the 81st most expensive. One bedroom rent jumped 5.3% to $800, while two bedrooms climbed 3.4% to $910.
–Honolulu, HI one bedroom rent grew 5.2% to $1,620 and moved up one ranking to 14th.
–Fresno, CA jumped 5 spots to rank as the 50th most expensive city with one bedroom rent increasing 5.1% to $1,040 and two bedrooms climbing 3.4% to $1,200.
–Providence, RI moved up 2 positions to become the 30th priciest market with one bedroom rent growing 5% to $1,270, while two bedroom rent was up 2.4% to $1,700.
Downward
–Rochester, NY saw one bedroom rent drop 5.2%, which was the biggest monthly dip in the country, to settle at $920. This city also moved down 6 spots to become the 63rd priciest.
–Oklahoma City, OK fell 6 positions to rank as the 86th most expensive market with one bedroom rent decreasing 5% to $760 and two bedroom rent dropping 4.3% to $900.
–Washington, D.C one bedroom rent dipped 1 ranking to 7th and decreased 4.3% to $2,230.
–Henderson, NV moved down 7 spots to become the 43rd priciest city with one bedroom rent dropping 2.7% to $1,100 and two bedrooms decreasing 0.7% to $1,350.
–Richmond, VA took an 8 ranking plunge to 48th with one bedroom rent falling 2.7% to $1,080 and two bedrooms decreasing 0.7% to $1,330.
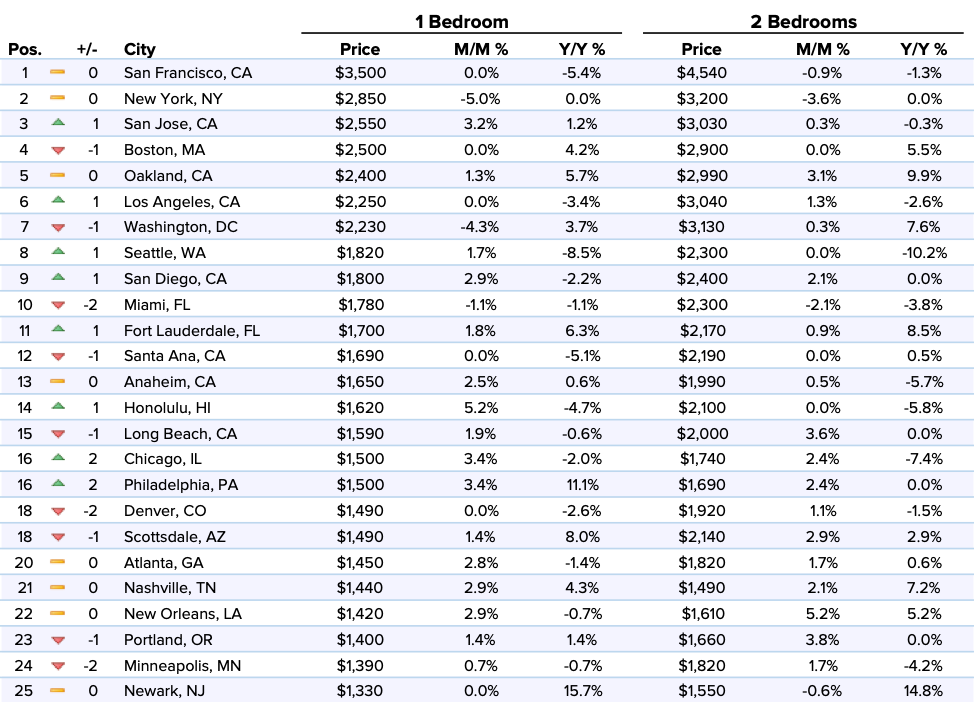
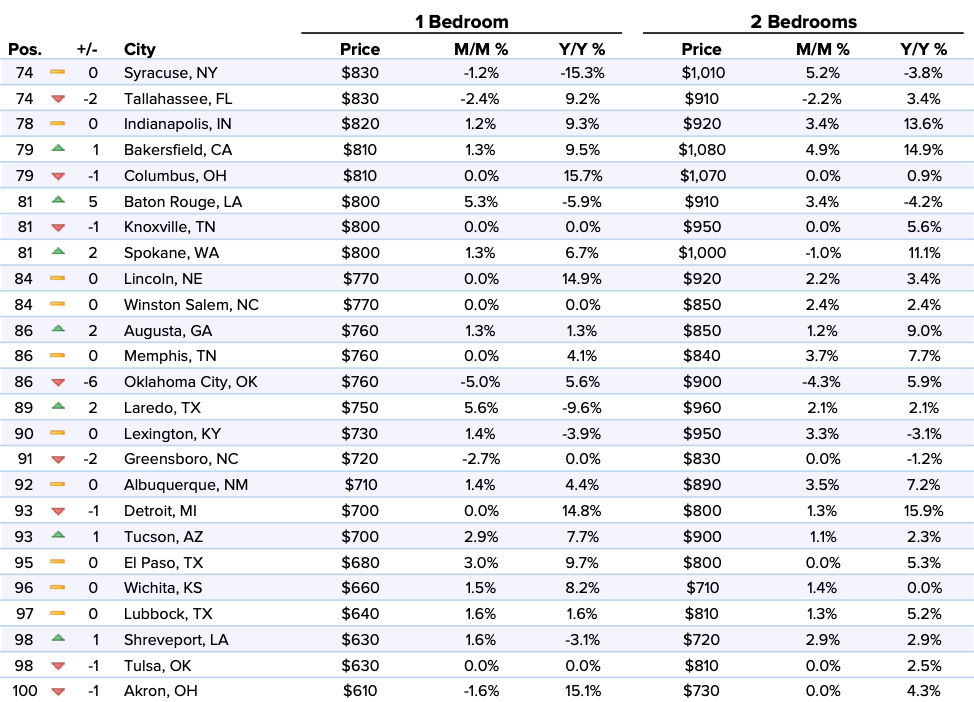
Full Data
| 1 Bedroom | 2 Bedrooms | ||||||
|---|---|---|---|---|---|---|---|
| Pos. | City | Price | M/M % | Y/Y % | Price | M/M % | Y/Y % |
| 1 | San Francisco, Californie | $3,500 | 0.00% | -5.40% | $4,540 | -0.90% | -1.30% |
| 2 | New York, NY | $2,850 | -5.00% | 0.00% | $3,200 | -3.60% | 0.00% |
| 3 | San Jose, CA | $2,550 | 3.20% | 1.20% | $3,030 | 0.30% | -0.30% |
| 4 | Boston, Massachusetts | $2,500 | 0.00% | 4.20% | $2,900 | 0.00% | 5.50% |
| 5 | Oakland, CA | $2,400 | 1.30% | 5.70% | $2,990 | 3.10% | 9.90% |
| 6 | Los Angeles, Californie | $2,250 | 0.00% | -3.40% | $3,040 | 1.30% | -2.60% |
| 7 | Washington, D.C. | $2,230 | -4.30% | 3.70% | $3,130 | 0.30% | 7.60% |
| 8 | Seattle, WA | $1,820 | 1.70% | -8.50% | $2,300 | 0.00% | -10.20% |
| 9 | San Diego, CA | $1,800 | 2.90% | -2.20% | $2,400 | 2.10% | 0.00% |
| 10 | Miami, Floride | $1,780 | -1.10% | -1.10% | $2,300 | -2.10% | -3.80% |
| 11 | Fort Lauderdale, FL | $1,700 | 1.80% | 6.30% | $2,170 | 0.90% | 8.50% |
| 12 | Santa Ana, CA | $1,690 | 0.00% | -5.10% | $2,190 | 0.00% | 0.50% |
| 13 | Anaheim, CA | $1,650 | 2.50% | 0.60% | $1,990 | 0.50% | -5.70% |
| 14 | Honolulu, HI | $1,620 | 5.20% | -4.70% | $2,100 | 0.00% | -5.80% |
| 15 | Long Beach, CA | $1,590 | 1.90% | -0.60% | $2,000 | 3.60% | 0.00% |
| 16 | Chicago, Illinois | $1,500 | 3.40% | -2.00% | $1,740 | 2.40% | -7.40% |
| 16 | Philadelphie, Pennsylvanie | $1,500 | 3.40% | 11.10% | $1,690 | 2.40% | 0.00% |
| 18 | Denver, Colorado | $1,490 | 0.00% | -2.60% | $1,920 | 1.10% | -1.50% |
| 18 | Scottsdale, AZ | $1,490 | 1.40% | 8.00% | $2,140 | 2.90% | 2.90% |
| 20 | Atlanta, Géorgie | $1,450 | 2.80% | -1.40% | $1,820 | 1.70% | 0.60% |
| 21 | Nashville, TN | $1,440 | 2.90% | 4.30% | $1,490 | 2.10% | 7.20% |
| 22 | New Orleans, LA | $1,420 | 2.90% | -0.70% | $1,610 | 5.20% | 5.20% |
| 23 | Portland, Oregon | $1,400 | 1.40% | 1.40% | $1,660 | 3.80% | 0.00% |
| 24 | Minneapolis, MN | $1,390 | 0.70% | -0.70% | $1,820 | 1.70% | -4.20% |
| 25 | Newark, NJ | $1,330 | 0.00% | 15.70% | $1,550 | -0.60% | 14.80% |
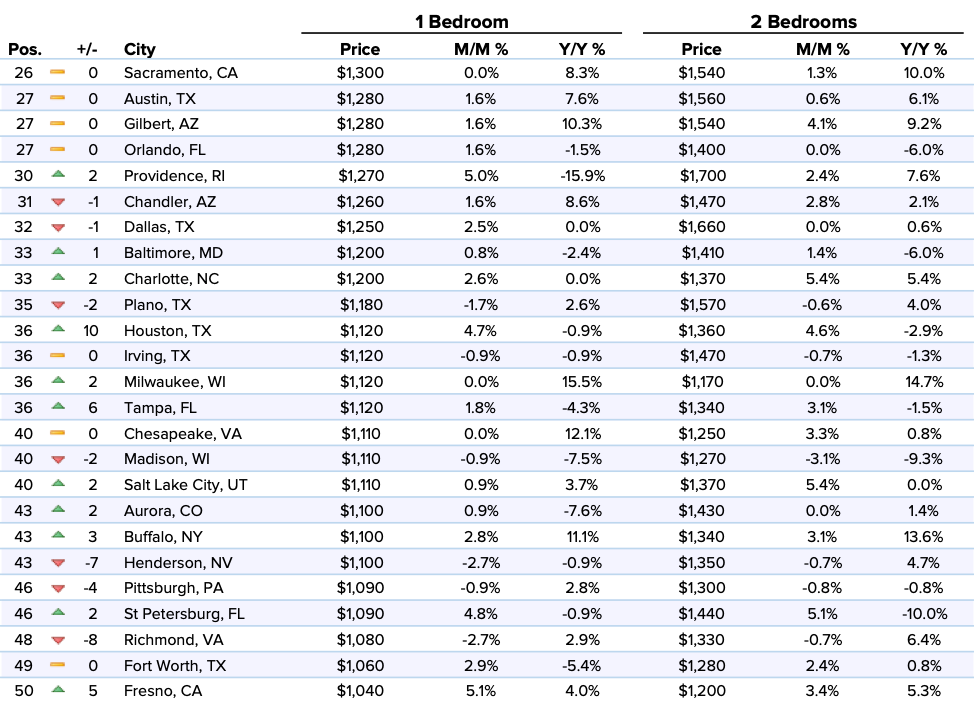
| 26 | Sacramento, CA | $1,300 | 0.00% | 8.30% | $1,540 | 1.30% | 10.00% |
| 27 | Austin, Texas | $1,280 | 1.60% | 7.60% | $1,560 | 0.60% | 6.10% |
| 27 | Gilbert, AZ | $1,280 | 1.60% | 10.30% | $1,540 | 4.10% | 9.20% |
| 27 | Orlando, Floride | $1,280 | 1.60% | -1.50% | $1,400 | 0.00% | -6.00% |
| 30 | Providence, RI | $1,270 | 5.00% | -15.90% | $1,700 | 2.40% | 7.60% |
| 31 | Chandler, AZ | $1,260 | 1.60% | 8.60% | $1,470 | 2.80% | 2.10% |
| 32 | Dallas, Texas | $1,250 | 2.50% | 0.00% | $1,660 | 0.00% | 0.60% |
| 33 | Baltimore, MD | $1,200 | 0.80% | -2.40% | $1,410 | 1.40% | -6.00% |
| 33 | Charlotte, Caroline du Nord | $1,200 | 2.60% | 0.00% | $1,370 | 5.40% | 5.40% |
| 35 | Plano, TX | $1,180 | -1.70% | 2.60% | $1,570 | -0.60% | 4.00% |
| 36 | Houston, Texas | $1,120 | 4.70% | -0.90% | $1,360 | 4.60% | -2.90% |
| 36 | Irving, TX | $1,120 | -0.90% | -0.90% | $1,470 | -0.70% | -1.30% |
| 36 | Milwaukee, WI | $1,120 | 0.00% | 15.50% | $1,170 | 0.00% | 14.70% |
| 36 | Tampa, Floride | $1,120 | 1.80% | -4.30% | $1,340 | 3.10% | -1.50% |
| 40 | Chesapeake, VA | $1,110 | 0.00% | 12.10% | $1,250 | 3.30% | 0.80% |
| 40 | Madison, WI | $1,110 | -0.90% | -7.50% | $1,270 | -3.10% | -9.30% |
| 40 | Salt Lake City, UT | $1,110 | 0.90% | 3.70% | $1,370 | 5.40% | 0.00% |
| 43 | Aurora, CO | $1,100 | 0.90% | -7.60% | $1,430 | 0.00% | 1.40% |
| 43 | Buffalo, NY | $1,100 | 2.80% | 11.10% | $1,340 | 3.10% | 13.60% |
| 43 | Henderson, NV | $1,100 | -2.70% | -0.90% | $1,350 | -0.70% | 4.70% |
| 46 | Pittsburgh, PA | $1,090 | -0.90% | 2.80% | $1,300 | -0.80% | -0.80% |
| 46 | St Petersburg, FL | $1,090 | 4.80% | -0.90% | $1,440 | 5.10% | -10.00% |
| 48 | Richmond, VA | $1,080 | -2.70% | 2.90% | $1,330 | -0.70% | 6.40% |
| 49 | Fort Worth, TX | $1,060 | 2.90% | -5.40% | $1,280 | 2.40% | 0.80% |
| 50 | Fresno, CA | $1,040 | 5.10% | 4.00% | $1,200 | 3.40% | 5.30% |
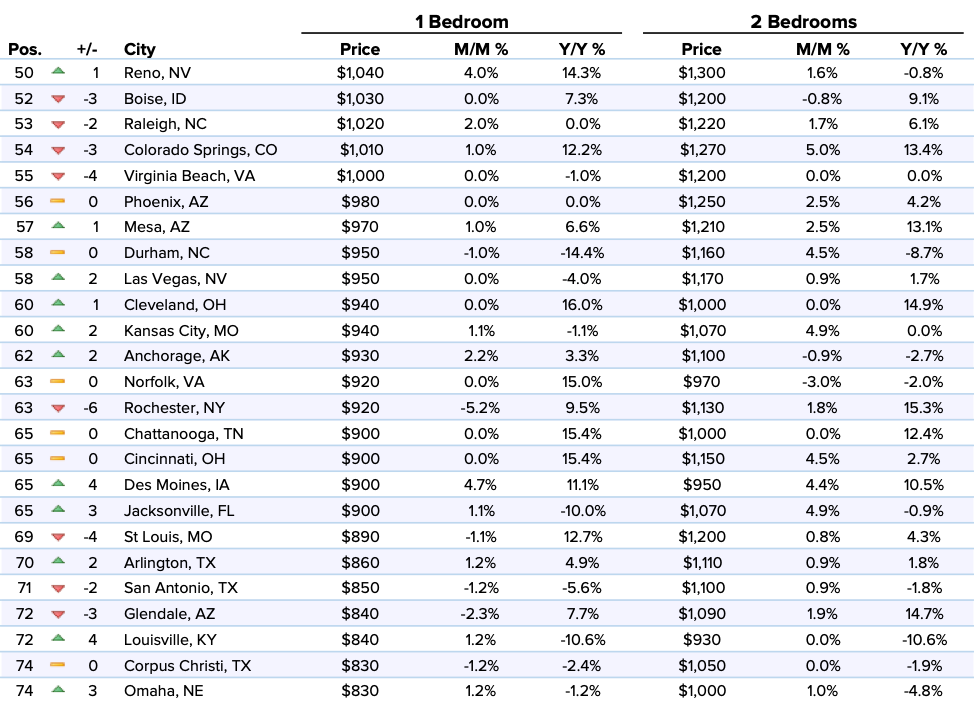
| 50 | Reno, NV | $1,040 | 4.00% | 14.30% | $1,300 | 1.60% | -0.80% |
| 52 | Boise, ID | $1,030 | 0.00% | 7.30% | $1,200 | -0.80% | 9.10% |
| 53 | Raleigh, NC | $1,020 | 2.00% | 0.00% | $1,220 | 1.70% | 6.10% |
| 54 | Colorado Springs, CO | $1,010 | 1.00% | 12.20% | $1,270 | 5.00% | 13.40% |
| 55 | Virginia Beach, VA | $1,000 | 0.00% | -1.00% | $1,200 | 0.00% | 0.00% |
| 56 | Phoenix, Arizona | $980 | 0.00% | 0.00% | $1,250 | 2.50% | 4.20% |
| 57 | Mesa, AZ | $970 | 1.00% | 6.60% | $1,210 | 2.50% | 13.10% |
| 58 | Durham, NC | $950 | -1.00% | -14.40% | $1,160 | 4.50% | -8.70% |
| 58 | Las Vegas, Nevada | $950 | 0.00% | -4.00% | $1,170 | 0.90% | 1.70% |
| 60 | Cleveland, OH | $940 | 0.00% | 16.00% | $1,000 | 0.00% | 14.90% |
| 60 | Kansas City, MO | $940 | 1.10% | -1.10% | $1,070 | 4.90% | 0.00% |
| 62 | Anchorage, AK | $930 | 2.20% | 3.30% | $1,100 | -0.90% | -2.70% |
| 63 | Norfolk, VA | $920 | 0.00% | 15.00% | $970 | -3.00% | -2.00% |
| 63 | Rochester, NY | $920 | -5.20% | 9.50% | $1,130 | 1.80% | 15.30% |
| 65 | Chattanooga, TN | $900 | 0.00% | 15.40% | $1,000 | 0.00% | 12.40% |
| 65 | Cincinnati, OH | $900 | 0.00% | 15.40% | $1,150 | 4.50% | 2.70% |
| 65 | Des Moines, IA | $900 | 4.70% | 11.10% | $950 | 4.40% | 10.50% |
| 65 | Jacksonville, FL | $900 | 1.10% | -10.00% | $1,070 | 4.90% | -0.90% |
| 69 | St Louis, MO | $890 | -1.10% | 12.70% | $1,200 | 0.80% | 4.30% |
| 70 | Arlington, TX | $860 | 1.20% | 4.90% | $1,110 | 0.90% | 1.80% |
| 71 | San Antonio, TX | $850 | -1.20% | -5.60% | $1,100 | 0.90% | -1.80% |
| 72 | Glendale, AZ | $840 | -2.30% | 7.70% | $1,090 | 1.90% | 14.70% |
| 72 | Louisville, KY | $840 | 1.20% | -10.60% | $930 | 0.00% | -10.60% |
| 74 | Corpus Christi, TX | $830 | -1.20% | -2.40% | $1,050 | 0.00% | -1.90% |
| 74 | Omaha, NE | $830 | 1.20% | -1.20% | $1,000 | 1.00% | -4.80% |
| 74 | Syracuse, NY | $830 | -1.20% | -15.30% | $1,010 | 5.20% | -3.80% |
| 74 | Tallahassee, FL | $830 | -2.40% | 9.20% | $910 | -2.20% | 3.40% |
| 78 | Indianapolis, IN | $820 | 1.20% | 9.30% | $920 | 3.40% | 13.60% |
| 79 | Bakersfield, CA | $810 | 1.30% | 9.50% | $1,080 | 4.90% | 14.90% |
| 79 | Columbus, Ohio | $810 | 0.00% | 15.70% | $1,070 | 0.00% | 0.90% |
| 81 | Baton Rouge, LA | $800 | 5.30% | -5.90% | $910 | 3.40% | -4.20% |
| 81 | Knoxville, TN | $800 | 0.00% | 0.00% | $950 | 0.00% | 5.60% |
| 81 | Spokane, WA | $800 | 1.30% | 6.70% | $1,000 | -1.00% | 11.10% |
| 84 | Lincoln, NE | $770 | 0.00% | 14.90% | $920 | 2.20% | 3.40% |
| 84 | Winston Salem, NC | $770 | 0.00% | 0.00% | $850 | 2.40% | 2.40% |
| 86 | Augusta, GA | $760 | 1.30% | 1.30% | $850 | 1.20% | 9.00% |
| 86 | Memphis, TN | $760 | 0.00% | 4.10% | $840 | 3.70% | 7.70% |
| 86 | Oklahoma City, OK | $760 | -5.00% | 5.60% | $900 | -4.30% | 5.90% |
| 89 | Laredo, TX | $750 | 5.60% | -9.60% | $960 | 2.10% | 2.10% |
| 90 | Lexington, KY | $730 | 1.40% | -3.90% | $950 | 3.30% | -3.10% |
| 91 | Greensboro, NC | $720 | -2.70% | 0.00% | $830 | 0.00% | -1.20% |
| 92 | Albuquerque, NM | $710 | 1.40% | 4.40% | $890 | 3.50% | 7.20% |
| 93 | Detroit, MI | $700 | 0.00% | 14.80% | $800 | 1.30% | 15.90% |
| 93 | Tucson, AZ | $700 | 2.90% | 7.70% | $900 | 1.10% | 2.30% |
| 95 | El Paso, TX | $680 | 3.00% | 9.70% | $800 | 0.00% | 5.30% |
| 96 | Wichita, KS | $660 | 1.50% | 8.20% | $710 | 1.40% | 0.00% |
| 97 | Lubbock, TX | $640 | 1.60% | 1.60% | $810 | 1.30% | 5.20% |
| 98 | Shreveport, LA | $630 | 1.60% | -3.10% | $720 | 2.90% | 2.90% |
| 98 | Tulsa, OK | $630 | 0.00% | 0.00% | $810 | 0.00% | 2.50% |
| 100 | Akron, OH | $610 | -1.60% | 15.10% | $730 | 0.00% | 4.30% |
*The current increase in availability of short-term rentals is especially useful for individuals who work in the medical field and need to be quarantined from their families for the time being, stranded travelers, and students without housing. Zumper has integrated Sonder and Blueground listings to make finding a short-term lease even easier. Sonder and Blueground listings on Zumper are month-to-month. Both companies emphasize the cleanliness of their apartments as well as their digital renting experiences to keep renters safe. You can search for short-term listings on Zumper by filtering by lease length.
About
The Zumper National Rent Report analyzes rental data from over 1 million active listings across the United States. Data is aggregated on a monthly basis to calculate median asking rents for the top 100 metro areas by population, providing a comprehensive view of the current state of the market. The report is based on all data available in the month prior to publication.
If you’re interested in a more in-depth explanation of how and why we calculate our rent data, view our methodology post.
To keep up to date with rent changes across the country, like or follow Zumper on Facebook, Gazouillement, and Instagram. In the market for a new place? Search apartments for rent on Zumper.
Contenu associé