Le tout premier rapport Zumper sur la région métropolitaine de Tampa a analysé les annonces immobilières actives en mars dans 13 villes de la région afin d'établir le classement des villes les plus et les moins chères, ainsi que celles où les loyers ont connu la plus forte croissance. Le loyer médian en Floride le mois dernier était de 1 400 000 $.
Classement des villes par loyer
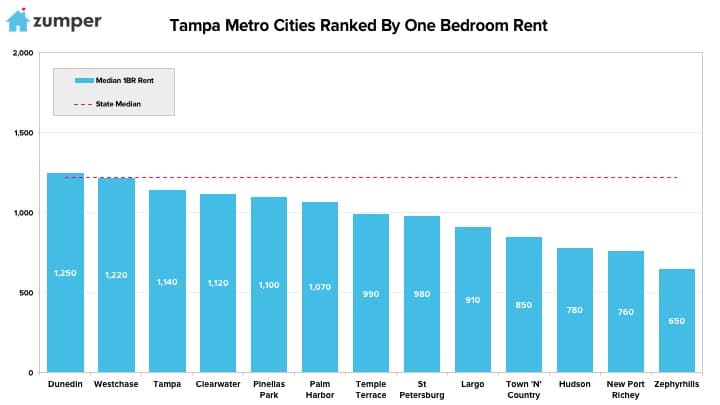
Le plus cher
–Dunedin, Floride Le loyer était le plus cher de la métropole, avec un appartement d'une chambre à coucher à 1 TP4 000 ₹ 1 250 ₹.
–Westchase, Floride suivi de près en deuxième position avec un loyer de $1 220.
–Tampa, Floride classé troisième avec un loyer de $1 140.
Le moins cher
–Zephyrhills, Floride était la ville la plus abordable, avec un loyer de $650.
–New Port Richey, Floride Le loyer était de $760, ce qui en faisait le deuxième moins cher.
–Hudson, Floride était troisième avec un loyer à $780.
taux de croissance
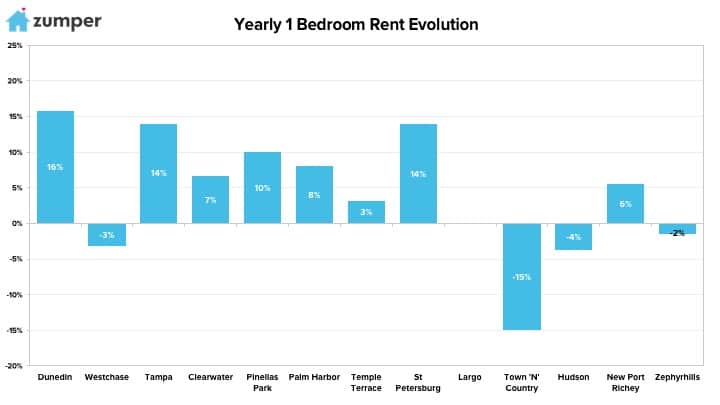
La croissance la plus rapide (Y/Y%)
–Dunedin, Floride a connu la plus forte croissance des loyers depuis l'an dernier à la même époque, avec une hausse de 15,7%.
–Tampa & Saint-Pétersbourg, Floride ex aequo en deuxième position, les loyers ayant tous deux augmenté de 14%.
–Pinellas Park, Floride a enregistré le troisième taux de croissance locative le plus élevé, bondissant de 10%.
La croissance la plus rapide (M/M%)
–Temple Terrace, Floride Le loyer a connu la plus forte croissance le mois dernier, en hausse de 5,31 TP3T.
–Pinellas Park, Floride était deuxième avec un loyer en hausse de 4,8%.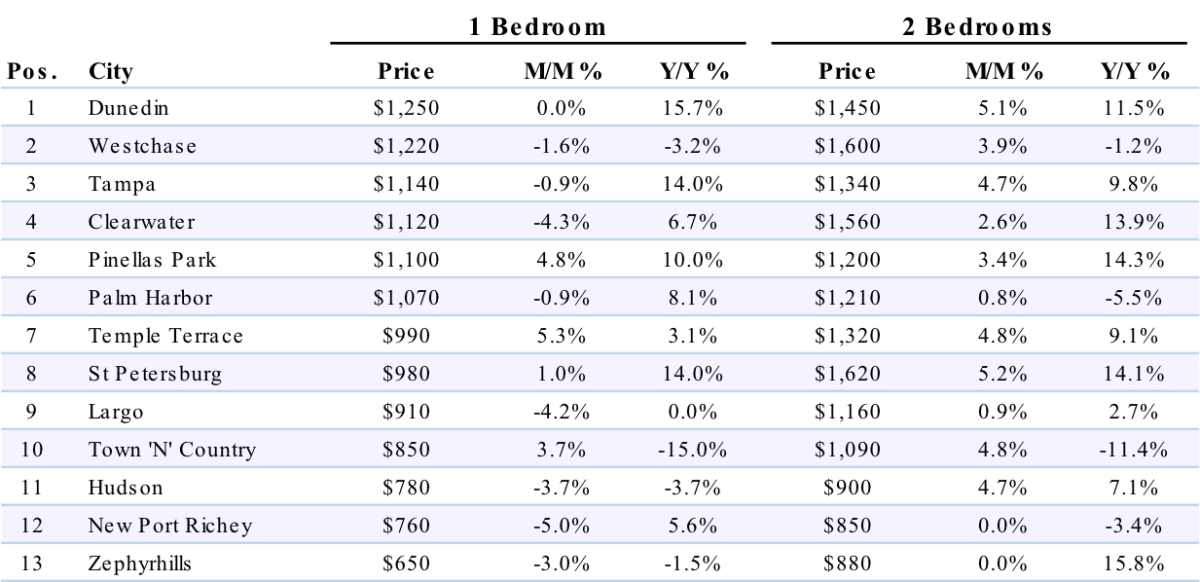
Données complètes
| 1 chambre | 2 chambres | ||||||
|---|---|---|---|---|---|---|---|
| Pos. | Ville | Prix | M/M % | Y/Y % | Prix | M/M % | Y/Y % |
| 1 | San Francisco, Californie | $3,490 | 1.50% | 3.60% | $4,600 | 1.10% | 2.20% |
| 2 | New York, NY | $2,860 | -1.00% | -1.40% | $3,200 | -3.90% | -5.90% |
| 3 | San José, Californie | $2,530 | 1.20% | 6.80% | $3,020 | 0.70% | 5.20% |
| 4 | Los Angeles, Californie | $2,340 | 1.70% | 9.90% | $3,290 | 1.50% | 7.90% |
| 5 | Boston, Massachusetts | $2,300 | 0.00% | 4.50% | $2,750 | 1.90% | 5.80% |
| 6 | Oakland, Californie | $2,170 | 3.30% | 2.80% | $2,500 | 0.00% | -2.00% |
| 7 | Washington, D.C. | $2,140 | -2.70% | -0.90% | $2,680 | -3.20% | -16.00% |
| 8 | Seattle, WA | $1,990 | 1.50% | 3.60% | $2,520 | -0.80% | 2.40% |
| 9 | San Diego, Californie | $1,840 | 2.20% | 15.00% | $2,400 | 1.30% | 9.10% |
| 10 | Miami, Floride | $1,800 | 2.90% | 0.00% | $2,470 | 3.80% | -1.20% |
| 11 | Honolulu, Hawaï | $1,730 | 3.00% | -2.80% | $2,200 | -4.30% | -8.30% |
| 12 | Santa Ana, Californie | $1,720 | 3.60% | 9.60% | $2,120 | 0.50% | 15.80% |
| 13 | Anaheim, Californie | $1,630 | -5.20% | 5.80% | $2,140 | 0.90% | 13.20% |
| 14 | Fort Lauderdale, Floride | $1,610 | 0.60% | 3.90% | $2,080 | 4.50% | 9.50% |
| 15 | Long Beach, Californie | $1,580 | 0.60% | 15.30% | $2,200 | 3.80% | 15.80% |
| 16 | Providence, Rhode Island | $1,520 | 4.80% | 14.30% | $1,590 | 5.30% | 13.60% |
| 17 | Chicago, Illinois | $1,500 | 0.00% | -14.80% | $1,900 | 5.00% | -15.90% |
| 18 | Philadelphie, Pennsylvanie | $1,490 | 2.80% | 8.00% | $1,700 | 3.00% | 8.30% |
| 19 | Denver, Colorado | $1,470 | 2.10% | 15.70% | $1,980 | 1.00% | 15.80% |
| 20 | Portland, Oregon | $1,450 | 0.70% | 4.30% | $1,750 | 4.80% | 9.40% |
| 21 | Atlanta, Géorgie | $1,420 | 0.70% | 8.40% | $1,810 | 0.60% | 9.70% |
| 22 | Minneapolis, Minnesota | $1,410 | -1.40% | 15.60% | $1,850 | -2.10% | 9.50% |
| 22 | Nouvelle-Orléans, Louisiane | $1,410 | 2.20% | 6.00% | $1,550 | 4.70% | -3.10% |
| 24 | Baltimore, Maryland | $1,400 | 0.70% | 10.20% | $1,610 | 3.20% | 15.00% |
| 25 | Nashville, Tennessee | $1,390 | 2.20% | 13.90% | $1,470 | 1.40% | 6.50% |
| 26 | Dallas, Texas | $1,310 | 0.80% | 1.60% | $1,790 | 2.90% | 1.70% |
| 27 | Houston, Texas | $1,300 | 3.20% | 14.00% | $1,610 | 3.20% | 14.20% |
| 27 | Madison, Wisconsin | $1,300 | 3.20% | 13.00% | $1,390 | -2.80% | 14.90% |
| 29 | Orlando, Floride | $1,270 | 4.10% | 15.50% | $1,460 | 3.50% | 15.00% |
| 30 | Charlotte, Caroline du Nord | $1,250 | 3.30% | 11.60% | $1,370 | 1.50% | 4.60% |
| 30 | Scottsdale, Arizona | $1,250 | 0.80% | 4.20% | $1,890 | -1.00% | -5.50% |
| 32 | Sacramento, Californie | $1,190 | -0.80% | 4.40% | $1,400 | 0.00% | 9.40% |
| 33 | Austin, Texas | $1,180 | 0.90% | 12.40% | $1,470 | 1.40% | 9.70% |
| 34 | Irving, Texas | $1,160 | 0.00% | 3.60% | $1,550 | -2.50% | 8.40% |
| 35 | Tampa, Floride | $1,140 | 0.90% | 10.70% | $1,380 | 0.70% | 12.20% |
| 36 | Plano, Texas | $1,130 | 0.00% | 3.70% | $1,510 | 0.70% | 4.10% |
| 37 | Aurora, Colorado | $1,110 | 0.00% | 11.00% | $1,450 | -0.70% | 6.60% |
| 38 | Durham, Caroline du Nord | $1,100 | 2.80% | 15.80% | $1,270 | 3.30% | 14.40% |
| 38 | Newark, NJ | $1,100 | 4.80% | 11.10% | $1,380 | 5.30% | 15.00% |
| 38 | Pittsburgh, Pennsylvanie | $1,100 | 1.90% | 0.90% | $1,350 | 0.70% | -1.50% |
| 41 | Buffalo, New York | $1,090 | 4.80% | 14.70% | $1,270 | 5.00% | 1.60% |
| 41 | Fort Worth, Texas | $1,090 | 0.00% | 14.70% | $1,300 | 1.60% | 15.00% |
| 41 | Gilbert, Arizona | $1,090 | 3.80% | 7.90% | $1,360 | 0.00% | 4.60% |
| 44 | Saint-Pétersbourg, Floride | $1,080 | 4.90% | 14.90% | $1,550 | -4.90% | 6.90% |
| 45 | Chandler, Arizona | $1,050 | 1.00% | 10.50% | $1,280 | 0.80% | 9.40% |
| 45 | Henderson, Nevada | $1,050 | 0.00% | 8.20% | $1,220 | 0.80% | 9.90% |
| 45 | Richmond, Virginie | $1,050 | -0.90% | 11.70% | $1,260 | -0.80% | 6.80% |
| 45 | Salt Lake City, Utah | $1,050 | -0.90% | 15.40% | $1,390 | 5.30% | 15.80% |
| 49 | Virginia Beach, Virginie | $1,040 | -1.90% | 7.20% | $1,200 | 0.00% | 1.70% |
| 50 | Chesapeake, Virginie | $1,010 | -2.90% | 9.80% | $1,200 | 0.00% | 1.70% |
| 51 | Raleigh, Caroline du Nord | $1,000 | 0.00% | -1.00% | $1,180 | 2.60% | 1.70% |
| 52 | Phoenix, Arizona | $980 | 3.20% | 10.10% | $1,190 | 1.70% | 10.20% |
| 53 | Kansas City, Missouri | $970 | 2.10% | 14.10% | $1,090 | 0.00% | 10.10% |
| 54 | Jacksonville, Floride | $950 | 2.20% | 9.20% | $1,090 | -0.90% | 0.00% |
| 55 | Milwaukee, Wisconsin | $930 | 1.10% | 14.80% | $1,090 | 4.80% | 16.00% |
| 56 | Colorado Springs, Colorado | $920 | 1.10% | 15.00% | $1,150 | 4.50% | 4.50% |
| 57 | Las Vegas, Nevada | $910 | 2.20% | 15.20% | $1,100 | 0.00% | 12.20% |
| 57 | Mesa, Arizona | $910 | 1.10% | 13.80% | $1,100 | 3.80% | 13.40% |
| 59 | Baton Rouge, Louisiane | $900 | 4.70% | 8.40% | $960 | 1.10% | 1.10% |
| 59 | Boise, Idaho | $900 | -1.10% | 5.90% | $950 | 0.00% | 4.40% |
| 61 | Fresno, Californie | $890 | -1.10% | 8.50% | $1,090 | 0.90% | 11.20% |
| 61 | San Antonio, Texas | $890 | 1.10% | 8.50% | $1,150 | 0.90% | 10.60% |
| 63 | Syracuse, New York | $880 | 4.80% | 15.80% | $1,030 | 5.10% | 3.00% |
| 64 | Anchorage, Alaska | $860 | -2.30% | -1.10% | $1,110 | 0.90% | -7.50% |
| 64 | Laredo, Texas | $860 | 4.90% | 14.70% | $990 | 2.10% | 15.10% |
| 66 | Corpus Christi, Texas | $850 | -2.30% | -2.30% | $1,090 | 3.80% | 9.00% |
| 66 | Louisville, Kentucky | $850 | -2.30% | 3.70% | $980 | 0.00% | 12.60% |
| 66 | Omaha, NE | $850 | -1.20% | 11.80% | $1,050 | 2.90% | 15.40% |
| 66 | Reno, Nevada | $850 | 4.90% | 13.30% | $1,270 | 5.00% | 15.50% |
| 70 | Des Moines, Iowa | $840 | 5.00% | 12.00% | $880 | 4.80% | 3.50% |
| 70 | Rochester, New York | $840 | 1.20% | 15.10% | $980 | 0.00% | 15.30% |
| 72 | Cincinnati, Ohio | $820 | -2.40% | 15.50% | $1,110 | 2.80% | 15.60% |
| 73 | Norfolk, Virginie | $810 | 5.20% | 15.70% | $970 | 2.10% | 7.80% |
| 74 | Cleveland, Ohio | $800 | 5.30% | 15.90% | $880 | 4.80% | 14.30% |
| 75 | Arlington, Texas | $780 | 0.00% | 14.70% | $1,060 | 1.90% | 15.20% |
| 75 | Bakersfield, Californie | $780 | 4.00% | 4.00% | $900 | 0.00% | 1.10% |
| 75 | Knoxville, Tennessee | $780 | 1.30% | 14.70% | $920 | 1.10% | 15.00% |
| 75 | Lexington, Kentucky | $780 | 5.40% | -1.30% | $950 | 0.00% | 0.00% |
| 79 | Saint-Louis, Missouri | $770 | -2.50% | 14.90% | $1,120 | 0.90% | 15.50% |
| 80 | Augusta, Géorgie | $760 | 1.30% | 15.20% | $840 | 3.70% | 10.50% |
| 80 | Chattanooga, Tennessee | $760 | -2.60% | 15.20% | $810 | -1.20% | 9.50% |
| 80 | Winston-Salem, Caroline du Nord | $760 | 4.10% | 15.20% | $820 | 2.50% | 15.50% |
| 83 | Tallahassee, Floride | $750 | 4.20% | 15.40% | $850 | 0.00% | 9.00% |
| 84 | Glendale, Arizona | $740 | -3.90% | 5.70% | $960 | 2.10% | 6.70% |
| 85 | Columbus, Ohio | $730 | 4.30% | 2.80% | $1,050 | 0.00% | 7.10% |
| 86 | Greensboro, Caroline du Nord | $710 | 1.40% | 9.20% | $840 | 3.70% | 7.70% |
| 86 | Memphis, Tennessee | $710 | 2.90% | 14.50% | $770 | 2.70% | 14.90% |
| 88 | Spokane, Washington | $700 | 0.00% | 7.70% | $860 | -4.40% | 0.00% |
| 89 | Indianapolis, Indiana | $690 | -2.80% | 15.00% | $810 | 1.30% | 15.70% |
| 90 | Oklahoma City, Oklahoma | $680 | 1.50% | 9.70% | $830 | 3.80% | 12.20% |
| 91 | Lincoln, NE | $670 | 4.70% | -5.60% | $890 | 4.70% | 7.20% |
| 92 | Albuquerque, Nouveau-Mexique | $650 | 1.60% | 8.30% | $840 | 5.00% | 7.70% |
| 93 | El Paso, Texas | $640 | 1.60% | 3.20% | $760 | -1.30% | -1.30% |
| 93 | Shreveport, Louisiane | $640 | 1.60% | 14.30% | $710 | 4.40% | 9.20% |
| 95 | Tucson, Arizona | $630 | -1.60% | -4.50% | $830 | -2.40% | -2.40% |
| 95 | Wichita, Kansas | $630 | 0.00% | 14.50% | $740 | 2.80% | 12.10% |
| 97 | Détroit, Michigan | $610 | 3.40% | 15.10% | $690 | 4.50% | 15.00% |
| 98 | Akron, Ohio | $600 | -1.60% | 13.20% | $740 | 1.40% | 10.40% |
| 98 | Tulsa, Oklahoma | $600 | -1.60% | 1.70% | $760 | 1.30% | 2.70% |
| 100 | Lubbock, Texas | $590 | -1.70% | 7.30% | $780 | 4.00% | 4.00% |
À propos
Le rapport Zumper Tampa Metro a analysé les biens immobiliers actifs mis sur le marché en mars 2018. Les annonces sont regroupées par ville pour calculer les loyers médians demandés.
Vous cherchez un nouveau logement ? Consultez toutes les annonces. Appartements à louer à Tampa Disponible dès maintenant sur Zumper.
Restez informé des actualités de Zumper en nous suivant sur Facebook, Gazouillement, Instagram, & Pinterest.
Contenu associé


