The Zumper SF Bay Area Metro Report analyzed over 14,000 active listings in April across 30 metro cities to show the most and least expensive cities and cities with the fastest growing rents.
Cities Ranked By Rent
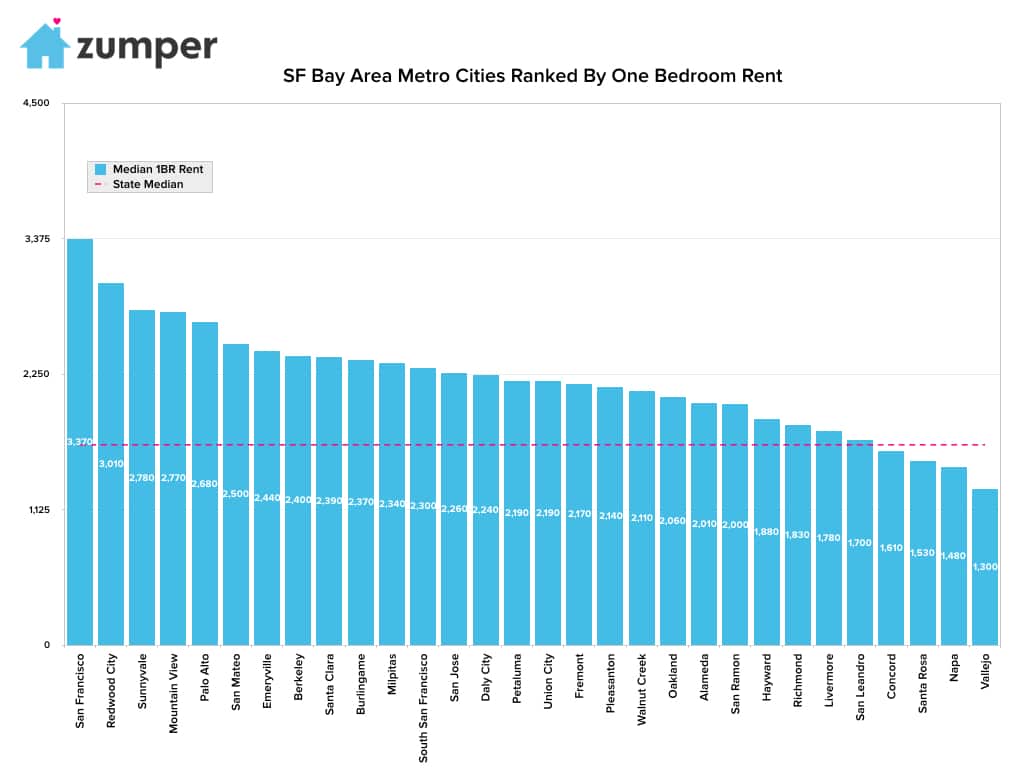
Most Expensive
– San Francisco, Californie rent grew $50 this month to $3,370 for one bedroom units.
– Redwood City, CA was the second most expensive city with rent growing $140 this month, surpassing the $3,000 threshold, to $3,010.
– Sunnyvale, CA ranked as third with rent at $2,780.
Least Expensive
– Vallejo, CA remained the least expensive city to rent with one bedroom units priced at $1,300.
– Napa, CA was the second most affordable city with rent at $1,480.
– Santa Rosa, CA followed behind as the third least expensive city at $1,530.
Growth Rate
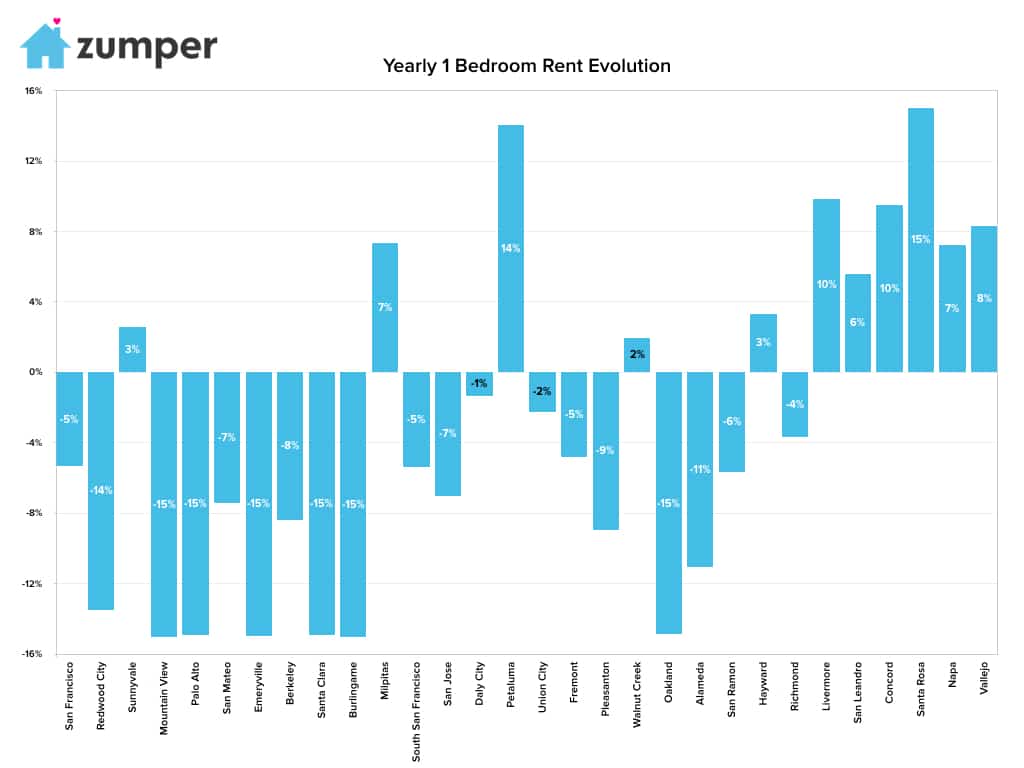
Fastest Growing (Y/Y%)
–Santa Rosa, CA rent had the largest yearly growth rate, up 15%.
–Petaluma, CA had the second fastest growing rent, climbing 14.1% since this time last year.
–Livermore, CA ranked as third with rent up 9.9% since last year.
Fastest Growing (M/M%)
–Redwood City, CA rent grew 4.9% since last month, making it the fastest growing in the metro area.
–Petaluma & Fremont, CA rents tied for the second fastest growing, both up 4.8% since last month.
–Santa Clara, CA was third with a 4.1% monthly growth rate.
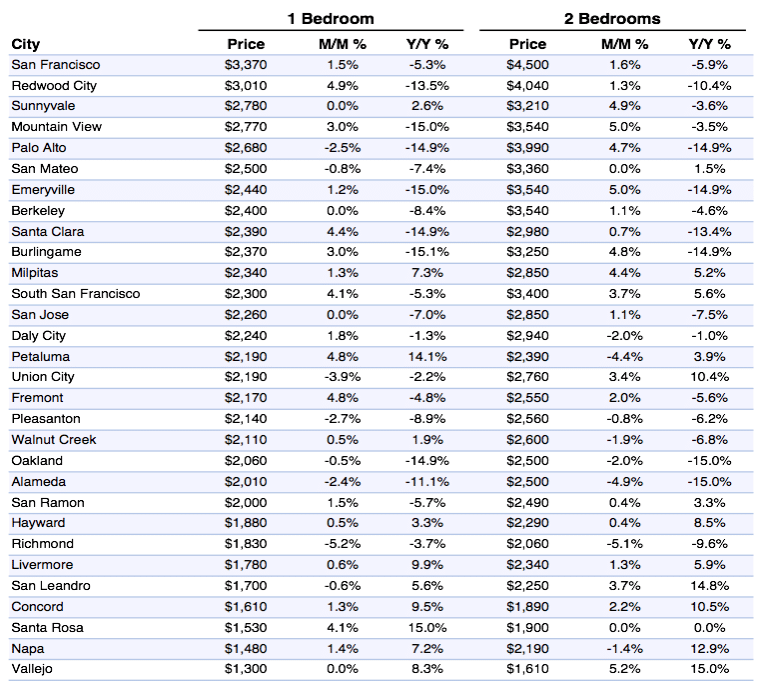
Full Data
| One Bedroom | Two Bedrooms | ||||||
|---|---|---|---|---|---|---|---|
| Pos. | City | Price | M/M % | Y/Y % | Price | M/M % | Y/Y % |
| 1 | West Linn | $1,450 | 2.80% | -5.20% | $1,640 | 5.10% | -15.00% |
| 2 | Portland | $1,390 | 3.70% | 6.10% | $1,600 | 0.60% | -1.80% |
| 3 | Hillsboro | $1,300 | -5.10% | -3.00% | $1,500 | 0.00% | -2.00% |
| 4 | Happy Valley | $1,260 | 5.00% | 14.50% | $1,450 | -1.40% | 15.10% |
| 5 | Tualatin | $1,260 | 5.00% | 5.00% | $1,290 | 4.90% | -0.80% |
| 6 | Gladstone | $1,250 | 0.00% | 13.60% | $1,400 | 1.40% | 15.70% |
| 7 | Lake Oswego | $1,210 | -3.20% | 2.50% | $1,470 | 0.00% | -5.20% |
| 8 | Wilsonville | $1,180 | 0.00% | -15.10% | $1,490 | 3.50% | -8.00% |
| 9 | Beaverton | $1,150 | 4.50% | 4.50% | $1,300 | 0.00% | 0.00% |
| 10 | Gresham | $1,030 | 2.00% | 9.60% | $1,190 | 0.00% | 6.30% |
| 11 | Tigard | $1,030 | 4.00% | 2.00% | $1,150 | 4.50% | -1.70% |
| 12 | Oregon City | $1,000 | 4.20% | 14.90% | $1,150 | -5.00% | 3.60% |
| 13 | Milwaukie | $990 | -3.90% | -3.90% | $1,290 | -0.80% | -0.80% |
| 14 | Forest Grove | $900 | -5.30% | 9.80% | $1,130 | 4.60% | 1.80% |
About
The Zumper SF Bay Area Metro Report analyzed over 14,000 listings that hit the market in April 2017. Listings are aggregated by city to calculate median asking rents.
In the market for a new place? Search all San Francisco apartments for rent on Zumper now.
Stay up to date with Zumper by following us on Facebook, Gazouillement, Instagram, & Pinterest.
Contenu associé