The Zumper SF Bay Area Metro Report analyzed over 15,000 active listings in March across 30 metro cities to show the most and least expensive cities and cities with the fastest growing rents.
Cities Ranked By Rent
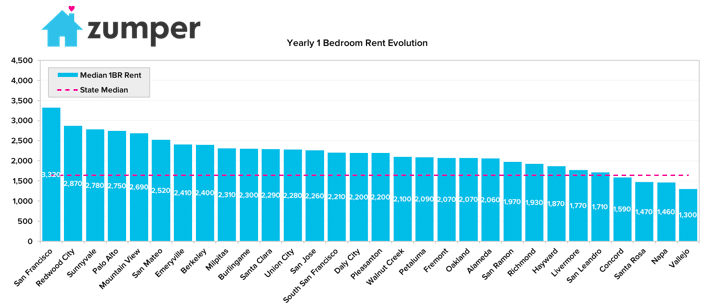
Most Expensive
– San Francisco, Californie, once again, was the most expensive city in the metro area. Median rent for one bedroom units in the city was $3,320.
– Redwood City, CA moved one spot up since the last rankings with rent climbing up to $2,870.
– Sunnyvale, CA rose two spots to find itself in the top three this month. Rent in Sunnyvale shot up this month to $2,780.
Least Expensive
– Vallejo, CA continued its trend as being the most affordable city with a median rent of $1300, $340 below the state median.
– Napa, CA posted a median price of $1,460, making it the second cheapest city to rent in the SF Bay Area metro.
– Santa Rosa, CA had minimal movement in the rankings and continued to be in the top 3 least expensive cities. Median rent for one bedroom apartments was $1,470.
Yearly Growth Rate
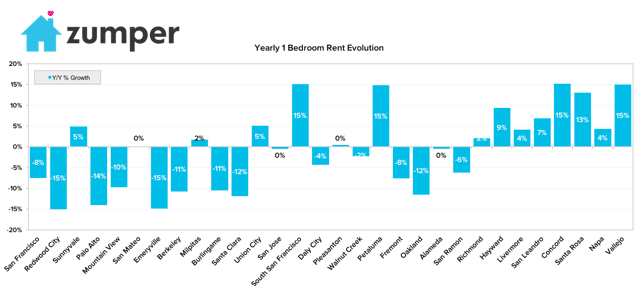
Fastest Growing (Y/Y%)
– Concord, CA rent had the largest yearly growth rate, up 15.2% since last year.
– South San Francisco, CA rent was a whopping 15.1% higher than twelve months ago.
– Vallejo, CA rent was the third fastest growing with a 15% year over year growth rate.
Fastest Growing (M/M%)
– Redwood City, CA had huge growth in prices this month as rent jumped 5.1%.
– Walnut Creek, CA and Santa Rosa, CA tied for second fastest month over month growth at 5%.
– Sunnyvale, CA prices shot up this month after experiencing 4.9% growth.
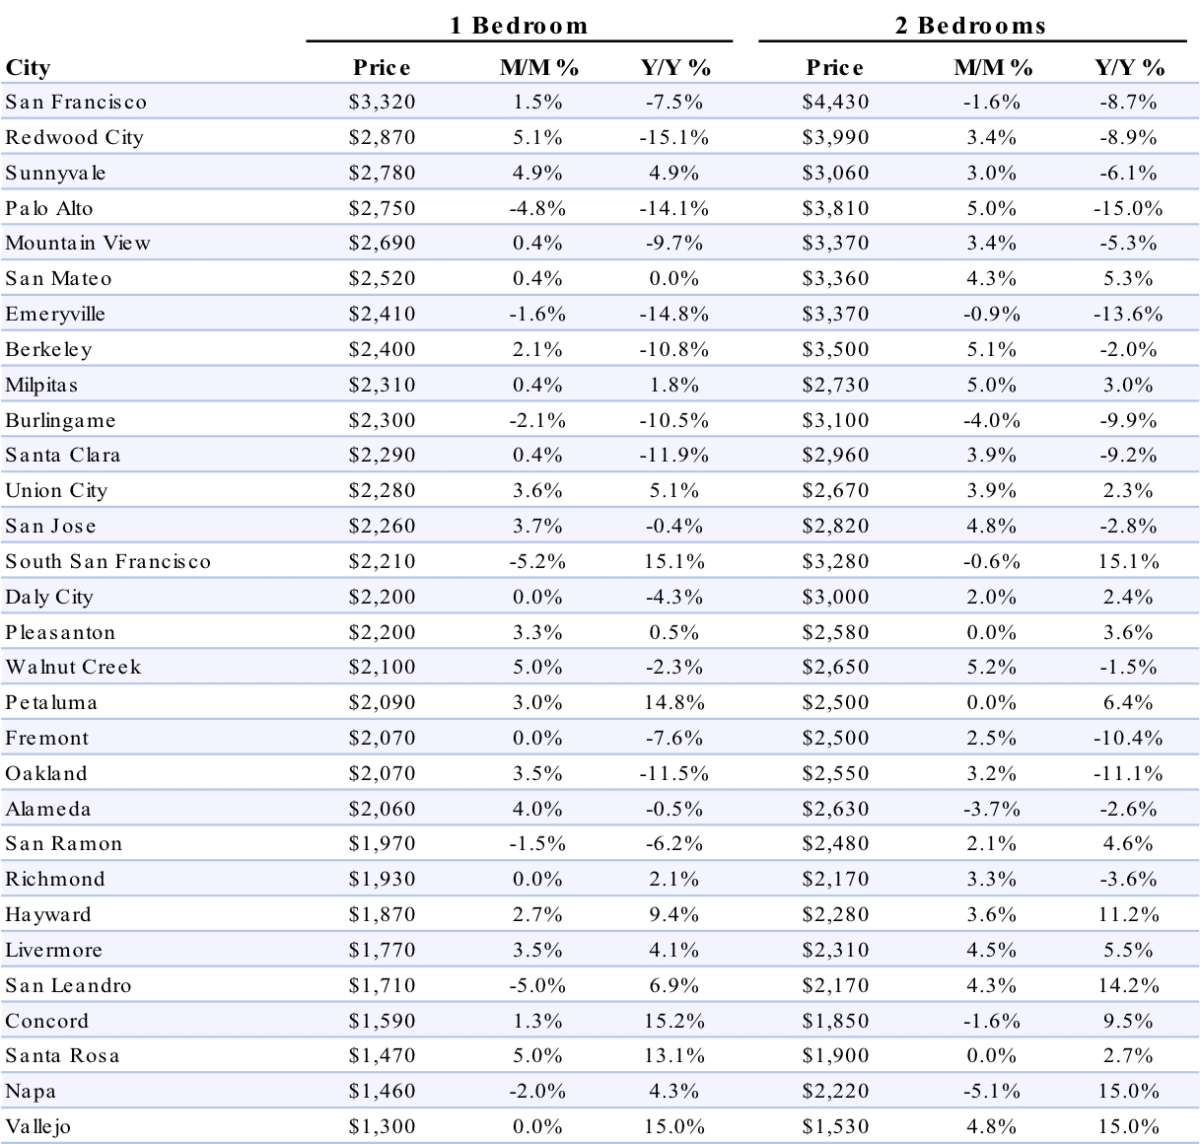
Full Data
| One Bedroom | Two Bedrooms | ||||||
|---|---|---|---|---|---|---|---|
| Pos. | City | Price | M/M % | Y/Y % | Price | M/M % | Y/Y % |
| 1 | Broomfield | $1,460 | 5.00% | 15.00% | $1,700 | -0.60% | 9.70% |
| 2 | Centennial | $1,310 | -0.80% | -5.10% | $1,700 | -0.60% | -5.00% |
| 3 | Parker | $1,240 | 3.30% | 6.00% | $1,540 | 1.30% | 3.40% |
| 4 | Denver | $1,210 | -3.20% | 0.00% | $1,680 | 1.80% | -4.00% |
| 4 | Lakewood | $1,210 | 5.20% | 10.00% | $1,310 | -1.50% | -2.20% |
| 5 | Westminster | $1,180 | 0.90% | 1.70% | $1,450 | 1.40% | 7.40% |
| 6 | Castle Rock | $1,150 | 4.50% | 6.50% | $1,440 | 2.90% | -0.70% |
| 7 | Littleton | $1,140 | -5.00% | 8.60% | $1,520 | 4.80% | -6.20% |
| 8 | Thornton | $1,060 | -5.40% | 0.00% | $1,340 | 0.00% | 8.10% |
| 9 | Northglenn | $1,040 | 1.00% | 2.00% | $1,300 | 4.00% | 11.10% |
| 10 | Arvada | $1,030 | 5.10% | 6.20% | $1,280 | -0.80% | 1.60% |
| 11 | Aurora | $1,020 | 0.00% | 7.40% | $1,360 | 4.60% | 3.00% |
About
The Zumper SF Bay Area Metro Report analyzed over 15,000 listings that hit the market in March 2017. Listings are aggregated by city to calculate median asking rents.
In the market for a new place? Search all San Francisco apartments for rent on Zumper now.
Stay up to date with Zumper by following us on Facebook, Gazouillement, Instagram, & Pinterest.
Contenu associé