According to our most recent national rent report, Los Angeles ranked as the 6th most expensive city in the country with one and two bedroom prices settling at $2,200 and $3,200, respectively. On a year over year basis, rents for both bedroom types are up around 10%. Check out which neighborhood lead the pack in rental growth and which took the biggest price dip below.
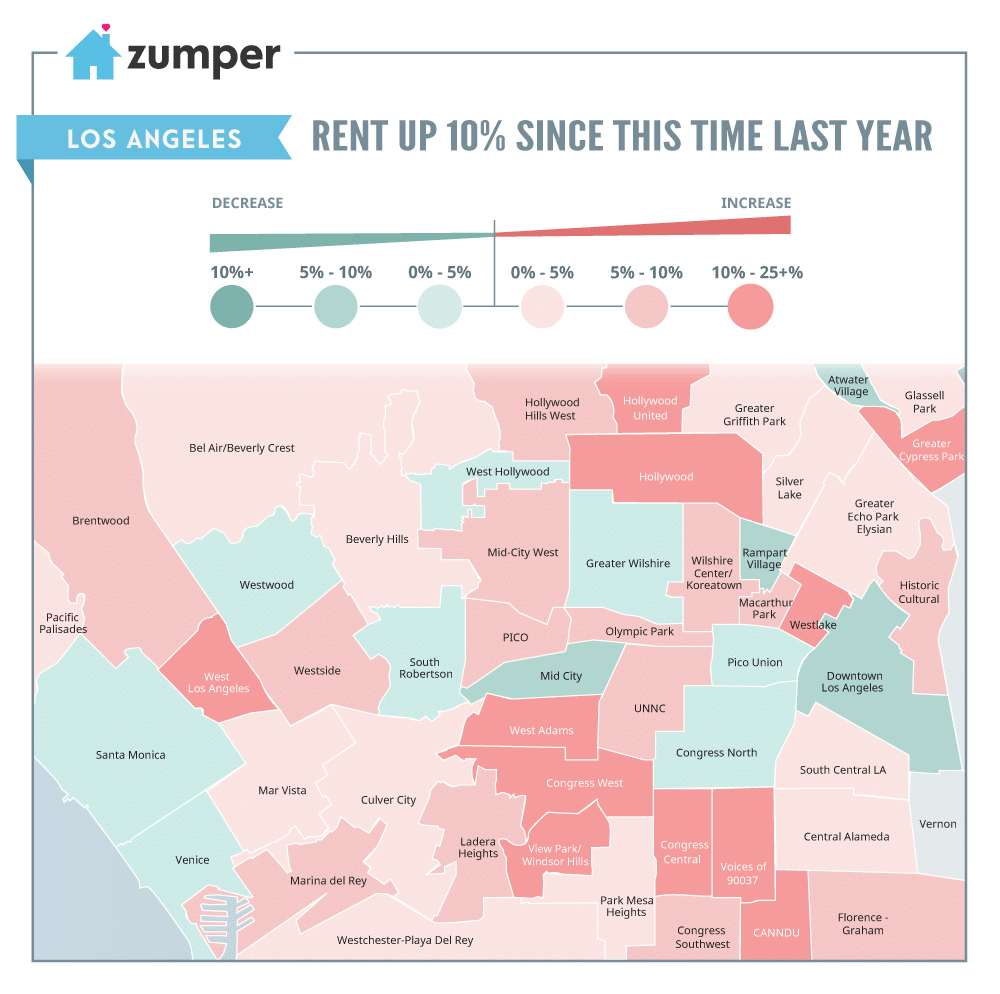
Overall, the Los Angeles neighborhoods in the green were a minority compared to the plethora of areas with growing rental rates. Some areas that tend to be extremely expensive, like Santa Monica and Downtown Los Angeles, saw rent dips while more affordable neighborhoods, like Congress Central and CANNDU, had large spikes in prices.
Leading the charge for the fastest growing area was View Park – Windsor Hills, with rent climbing 25% since this time last year. Congress Central (+20%), Voices of 90037 (+19%), and CANNDU (+18%) had the next biggest rental growth rates. On the other end of the cost spectrum, Downtown Los Angeles and Rampart Village saw the largest rent dips, both falling around 8%.
If you want to see how rent in Los Angeles compares with the rest of the nation’s, view our National Rent Report for March, which analyzes over 1 million active listings available in the prior month.
To keep up to date with rent changes across the country, like or follow Zumper on Facebook, Twitter, Pinterest, and Instagram. In the market for a new place? Search all Los Angeles apartments for rent on Zumper.
For a more in-depth look into why and how we calculate our rental data, check out our methodology post here.
Full Data
| 1 Bedroom | 2 Bedrooms | ||||||
|---|---|---|---|---|---|---|---|
| Pos. | City | Price | M/M % | Y/Y % | Price | M/M % | Y/Y % |
| 1 | San Francisco | $3,400 | 0.00% | 2.40% | $4,510 | 2.50% | 1.80% |
| 2 | Mountain View | $3,110 | 0.30% | 15.60% | $3,890 | 3.50% | 15.40% |
| 3 | Emeryville | $2,790 | -1.10% | 15.80% | $3,740 | 0.50% | 11.00% |
| 4 | Palo Alto | $2,750 | -1.40% | 0.00% | $3,520 | 5.10% | -7.60% |
| 5 | Redwood City | $2,730 | 5.00% | -4.90% | $3,500 | 5.10% | -12.30% |
| 6 | Sunnyvale | $2,640 | 5.20% | -5.00% | $3,400 | 4.90% | 11.10% |
| 7 | Burlingame | $2,620 | 4.40% | 13.90% | $3,390 | 5.00% | 9.40% |
| 8 | Santa Clara | $2,560 | -3.00% | 11.80% | $3,270 | 0.30% | 10.50% |
| 9 | San Mateo | $2,540 | 0.40% | 0.80% | $3,460 | 0.90% | 3.00% |
| 10 | South San Francisco | $2,530 | -1.90% | 14.50% | $3,490 | -0.30% | 6.40% |
| 11 | Berkeley | $2,500 | 4.20% | 4.20% | $3,280 | 5.10% | -6.30% |
| 12 | San Jose | $2,470 | 0.80% | 9.30% | $2,940 | 3.90% | 4.30% |
| 13 | Milpitas | $2,440 | -1.20% | 5.60% | $2,820 | 2.50% | 3.30% |
| 14 | Walnut Creek | $2,350 | 1.70% | 11.90% | $2,760 | 4.90% | 4.20% |
| 15 | Union City | $2,320 | 5.00% | 1.80% | $2,380 | -5.20% | -10.90% |
| 16 | Fremont | $2,300 | -4.20% | 11.10% | $2,590 | 4.40% | 3.60% |
| 17 | Daly City | $2,280 | -5.00% | 3.60% | $3,020 | -2.60% | 0.70% |
| 18 | Pleasanton | $2,250 | 2.30% | 2.30% | $2,720 | 5.00% | 5.40% |
| 19 | Petaluma | $2,170 | -4.80% | 3.80% | $2,670 | 5.10% | 6.80% |
| 20 | Oakland | $2,130 | -0.50% | 2.90% | $2,470 | 5.10% | -3.10% |
| 21 | San Ramon | $2,010 | -5.20% | 2.00% | $2,490 | -2.40% | 0.40% |
| 22 | Alameda | $2,000 | -2.90% | -2.90% | $2,750 | -0.70% | 4.60% |
| 22 | Livermore | $2,000 | -4.80% | 13.00% | $2,410 | 0.40% | 4.30% |
| 24 | Richmond | $1,980 | -4.80% | 2.60% | $2,400 | 4.30% | 10.60% |
| 25 | Hayward | $1,970 | -1.00% | 5.30% | $2,340 | 2.20% | 2.60% |
| 26 | San Leandro | $1,870 | 5.10% | 9.40% | $2,270 | 0.40% | 4.60% |
| 27 | Concord | $1,730 | -4.90% | 8.80% | $1,980 | 1.50% | 7.00% |
| 28 | Napa | $1,650 | -2.90% | 13.00% | $2,100 | -4.50% | -5.40% |
| 29 | Santa Rosa | $1,570 | -1.90% | 6.80% | $2,070 | -4.60% | 8.90% |
| 30 | Vallejo | $1,420 | -4.70% | 9.20% | $1,650 | 3.10% | 7.80% |
Contenu associé


