The Zumper San Francisco Bay Area Metro Report analyzed over 11,000 active listings in February across the 29 metro cities to show the most and least expensive cities and cities with the fastest growing rents.
Cities Ranked By Rent
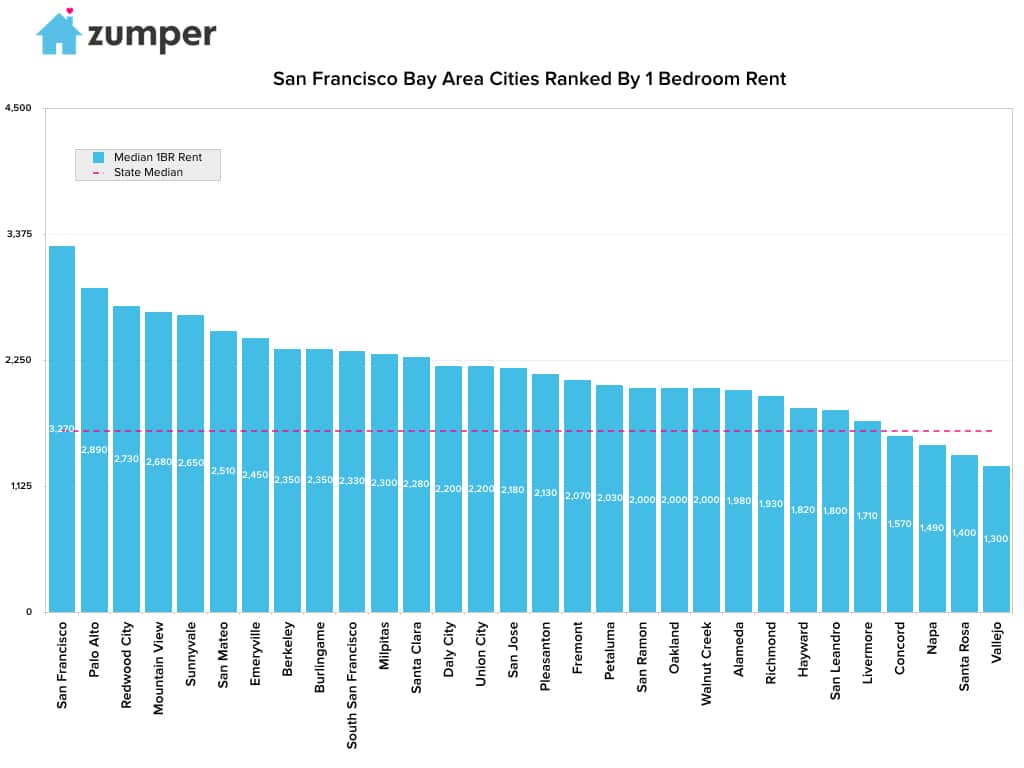
Most Expensive
–San Francisco, Californie ranked as the most expensive city in the metro area with a $3,270 one bedroom median. Rent here was more than double the $1,617 state median.
–Palo Alto, CA, a few hundred dollars behind first place, had a one bedroom median of $2,890.
–Redwood City, CA was the third most expensive city with one bedroom units priced at $2,730.
Least Expensive
–Vallejo, CA was the most affordable city to rent in the metro area. One bedroom rent here was $1,300, marking a nearly two thousand dollar difference between this city and San Francisco.
–Santa Rosa, CA rent for one bedroom units settled at $1,400, making it the second least expensive city to rent.
–Napa, CA followed closely behind with a $1,490 one bedroom median.
Yearly Growth Rate
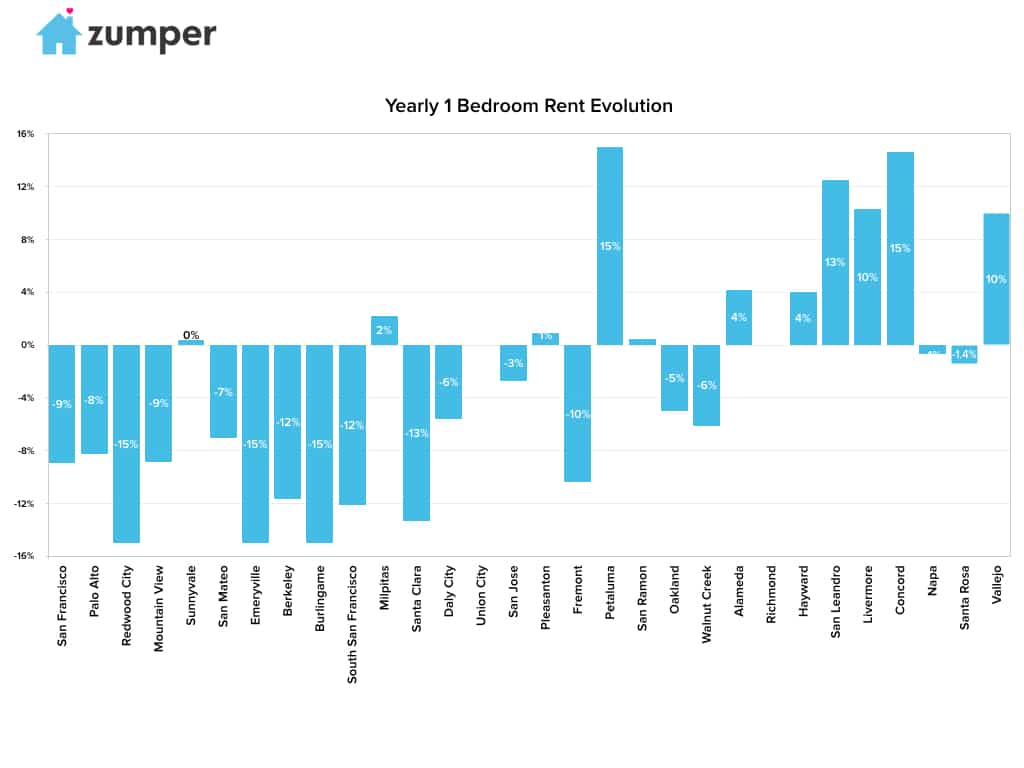
Fastest Growing
–Petaluma, CA had the fastest growing one bedroom rents, up 15% since last year.
–Concord, CA rents grew 14.6% since this time last year, making it the second fastest growing.
–San Leandro, CA ranked right after Concord with a 12.5% yearly growth rate.
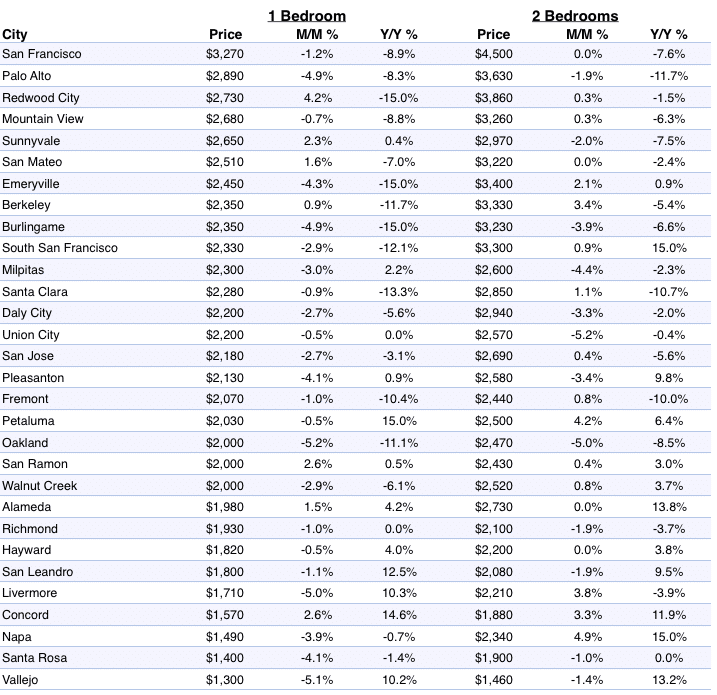
Full Data
| City | Price | M/M % | Y/Y % | Price | M/M % | Y/Y % | |
|---|---|---|---|---|---|---|---|
| Portland | 1340 | -0.014705882352941 | 0.0075187969924813 | 1600 | 0.0062893081761006 | -0.0062111801242236 | |
| Hillsboro | 1330 | 0 | 0.031007751937985 | 1500 | 0.0067114093959733 | 0.048951048951049 | |
| Lake Oswego | 1200 | 0.052631578947368 | 0.0084033613445378 | 1500 | 0.020408163265306 | -0.0066225165562914 | |
| Tualatin | 1200 | -0.0082644628099173 | 0.10091743119266 | 1220 | -0.039370078740158 | 0.025210084033613 | |
| Wilsonville | 1180 | 0.053571428571429 | 0.082568807339449 | 1420 | 0.044117647058824 | 0.11811023622047 | |
| Happy Valley | 1140 | 0.017857142857143 | 0.096153846153846 | 1400 | 0.052631578947368 | 0.11111111111111 | |
| Beaverton | 1090 | -0.018018018018018 | 0 | 1300 | -0.037037037037037 | 0 | |
| Milwaukie | 1050 | -0.054054054054054 | 0.05 | 1280 | 0.040650406504065 | 0.13274336283186 | |
| Gresham | 1010 | 0.02020202020202 | 0.14772727272727 | 1130 | 0 | 0.05607476635514 | |
| Oregon City | 910 | 0.045977011494253 | -0.09 | 1250 | 0.0080645161290323 | -0.015748031496063 |
About
The Zumper San Francisco Bay Area Metro Report analyzed over 11,000 listings that hit the market in February 2017. Listings are aggregated by city to calculate median asking rents.
In the market for a new place? Search all San Francisco apartments for rent on Zumper now.
Stay up to date with Zumper by following us on Facebook, Gazouillement, Instagram, & Pinterest.
Contenu associé