Le rapport Zumper sur la région métropolitaine de San Diego a analysé les annonces immobilières actives en septembre dans 15 villes métropolitaines afin d'établir le classement des villes les plus et les moins chères, ainsi que celles où les loyers ont connu la plus forte croissance. Le loyer médian en Californie était de 1 400 000 $ le mois dernier.
Classement des villes par loyer
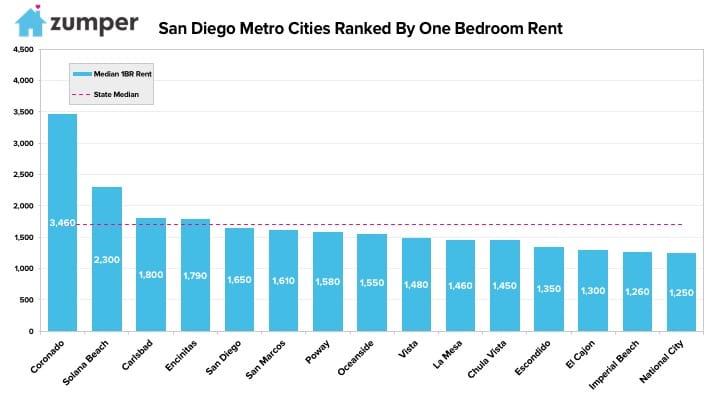
Le plus cher
–Coronado, Californie Bien que le loyer ait baissé de près de 5% à $3 460 le mois dernier, il est resté le plus cher de la métropole.
–Solana Beach, Californie Elle a suivi la même voie en tant que deuxième ville la plus chère avec un loyer de $2 300.
–Carlsbad, Californie Elle a conservé sa troisième place devant Encinitas avec un loyer de $1 800.
Le moins cher
–National City, Californie était la ville la plus abordable pour louer un appartement d'une chambre à coucher, à un prix de $1 250.
–Imperial Beach, Californie Le loyer n'était que de $10 plus cher que celui de National City, à $1 260, ce qui en fait le deuxième moins cher de la métropole.
–El Cajon, Californie classé troisième avec un loyer de $1 300.
taux de croissance
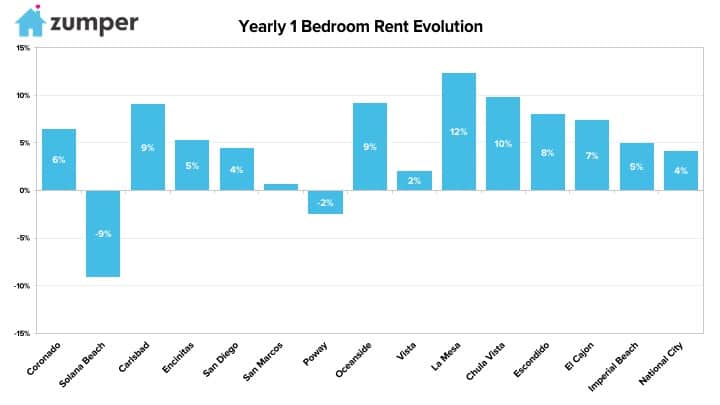
La croissance la plus rapide (Y/Y%)
–La Mesa, Californie a enregistré la plus forte croissance des loyers depuis le mois dernier, en hausse de 12,31 TP3T.
–Chula Vista, Californie Le loyer a suivi la même tendance, se classant au deuxième rang des secteurs à la croissance la plus rapide, avec une hausse de 9,8%.
–Carlsbad, Californie se classait troisième avec un taux de croissance mensuel de 9,1%.
La croissance la plus rapide (M/M%)
–San Marcos, Californie Le loyer a bondi de 5,21 TP3 TP le mois dernier, ce qui en fait la croissance la plus rapide de la métropole.
–Solana Beach, Californie Les prix ont connu la deuxième plus forte croissance, grimpant de 5% le mois dernier.
–Escondido, Californie a enregistré le troisième taux de croissance mensuel le plus élevé, en hausse de 4,7%.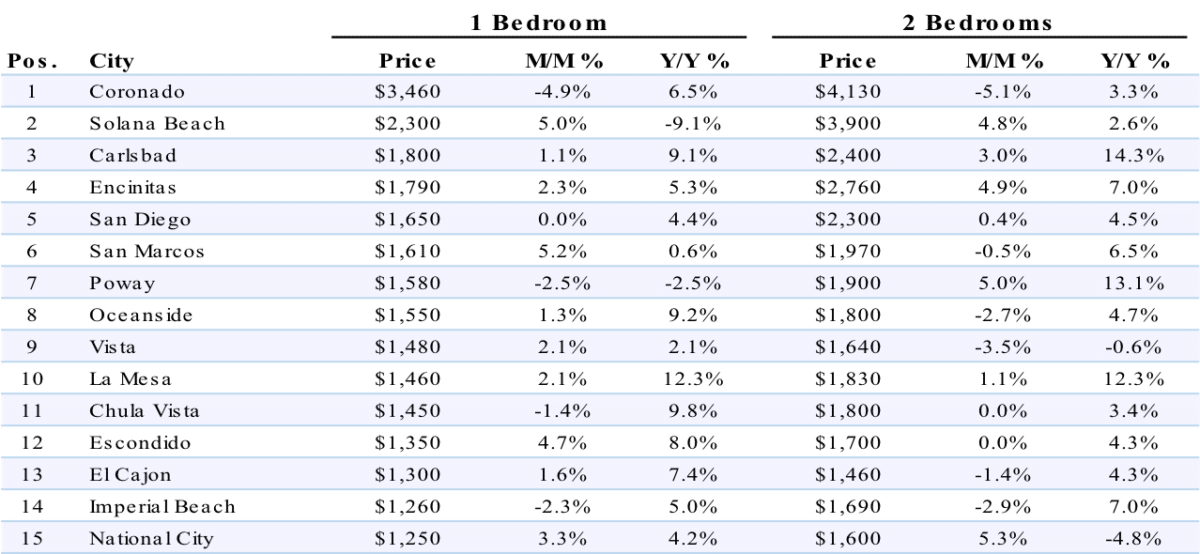
Données complètes
Rang Ville État Score % de Parkland Score des parcs pour 1 000 habitants Score de température Nombre de courses Score Score d'accessibilité au loyer Dans l'ensemble Grade
1 San Diego Californie 91.9 85.9 74.0 90.8 10.1 77.8 A+
2 San Antonio TX 56.6 65.7 84.0 99.0 59.6 76.2 A+
3 Houston TX 74.7 71.7 92.0 84.7 25.3 76.0 A+
4 Las Vegas NV 86.9 78.8 70.0 71.4 64.6 75.0 A+
5 Phénix AZ 78.8 82.8 80.0 57.1 55.6 72.2 A+
6 Austin TX 61.6 69.7 84.0 75.5 33.3 69.5 A
7 La Nouvelle-Orléans LA 94.9 94.9 84.0 32.7 20.2 69.2 A
8 Plage de Virginia Virginie 80.8 92.9 56.0 65.3 36.4 68.7 A
9 Dallas TX 65.7 66.7 78.0 81.6 19.2 68.3 A
10 Tampa FL 39.4 58.6 96.0 69.4 34.3 64.4 A
11 Cincinnati OH 73.7 67.7 32.0 74.5 78.8 62.8 UN-
12 Nashville TN 60.6 91.9 54.0 62.2 26.3 62.2 UN-
13 Los Angeles Californie 67.7 34.3 76.0 87.8 5.1 61.9 UN-
14 Portland OU 83.8 71.7 32.0 78.6 18.2 60.6 UN-
15 Oklahoma City D'ACCORD 35.4 88.9 66.0 41.8 83.8 60.2 UN-
16 Colomb OH 63.6 63.6 26.0 79.6 78.8 59.7 B+
17 Orlando FL 21.2 39.4 94.0 76.5 28.3 57.6 B+
18 San Francisco Californie 87.9 15.2 46.0 98.0 0.0 56.6 B+
19 Atlanta Géorgie 26.3 40.4 68.0 94.9 16.2 55.7 B+
20 Louisville KY 38.4 70.7 48.0 64.3 50.5 54.9 B+
21 Charlotte Caroline du Nord 13.1 51.5 56.0 92.9 32.3 53.4 B
22 New York New York 88.9 6.1 36.0 100.0 1.0 53.1 B
23 Philadelphie Pennsylvanie 68.7 15.2 40.0 95.9 14.1 52.2 B
24 San José Californie 74.7 61.6 60.0 37.8 2.0 51.9 B
25 Indianapolis DANS 18.2 51.5 26.0 84.7 91.9 50.8 B
26 Memphis TN 16.2 53.5 70.0 41.8 83.8 50.3 B-
27 Seattle Washington 65.7 35.4 26.0 89.8 7.1 49.9 B-
28 Boston MA 82.8 21.2 16.0 96.9 4.0 49.4 B-
29 Baltimore MARYLAND 54.5 21.2 36.0 86.7 28.3 48.6 B-
30 Pittsburgh Pennsylvanie 58.6 45.5 16.0 82.7 22.2 47.7 B-
31 Minneapolis MN 77.8 47.5 0.0 80.6 24.2 47.6 C+
32 Miami FL 32.3 3.0 100.0 45.9 8.1 44.3 C+
33 Sacramento Californie 43.4 36.4 62.0 38.8 29.3 44.1 C+
34 Denver CO 45.5 32.3 15.0 91.8 15.2 43.8 C+
35 Milwaukee WI 57.6 38.4 2.0 67.3 54.5 42.0 C+
À propos
Le rapport Zumper San Diego Metro a analysé les annonces actives mises sur le marché en septembre 2017. Les annonces sont regroupées par ville pour calculer les loyers médians demandés.
Vous cherchez un nouveau logement ? Consultez toutes les annonces. Appartements à louer à San Diego Disponible dès maintenant sur Zumper.
Restez informé des actualités de Zumper en nous suivant sur Facebook, Gazouillement, Instagram, & Pinterest.
Contenu associé


