The Zumper San Diego Metro Report analyzed over 11,000 active listings in April across 14 metro cities to show the most and least expensive cities and cities with the fastest growing rents.
Cities Ranked By Rent
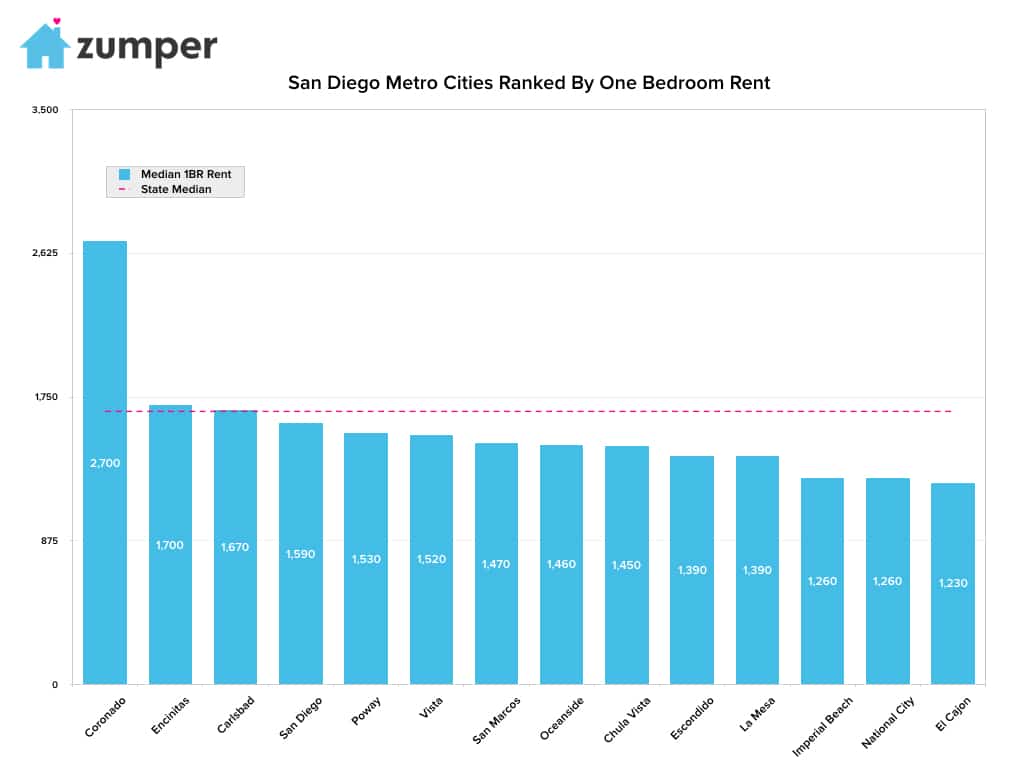
Most Expensive
–Coronado, CA was the most expensive city to rent in the metro area. One bedroom units here were priced at a median of $2,700.
–Encinitas, CA, significantly less expensive than Coronado, ranked as the second priciest city with rent at $1,700.
–Carlsbad, CA followed closely behind as the third most expensive city at $1,670.
Least Expensive
–El Cajon, CA was the least expensive city to rent with one bedroom units priced at $1,230.
–National City & Imperial Beach, CA were tied for the second most affordable city with rent both at $1,260.
–La Mesa & Escondido, CA also tied, both ranking as the third least expensive with rent at $1,390.
Yearly Growth Rate
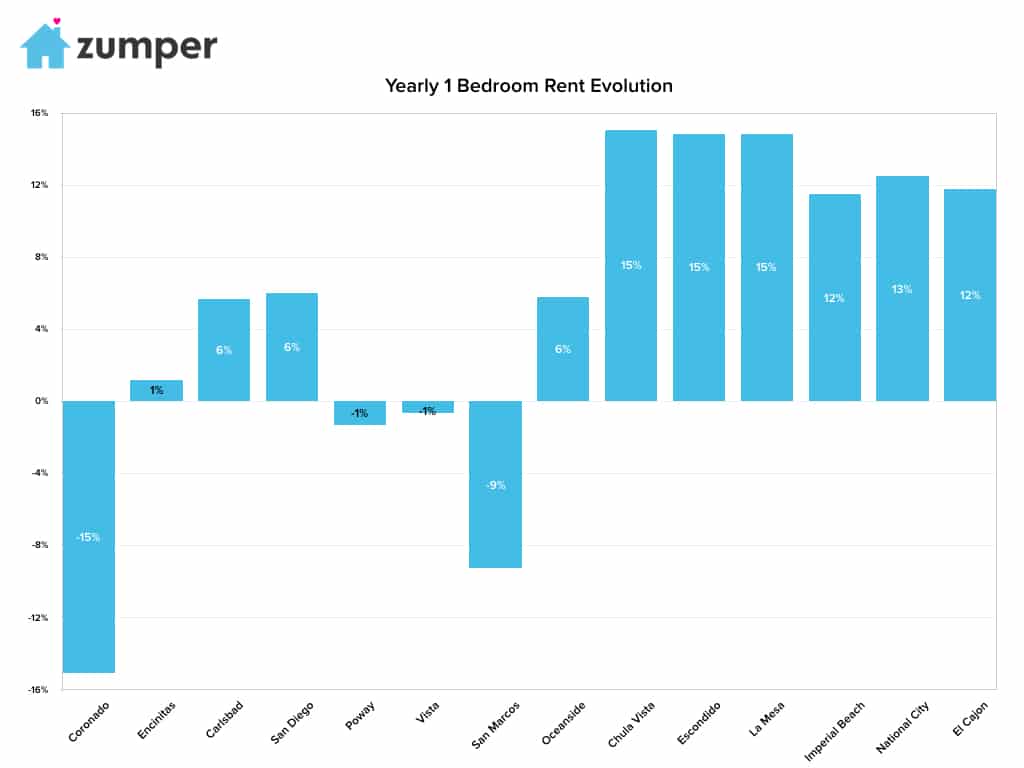
La croissance la plus rapide (Y/Y%)
–Chula Vista, CA had the fastest growing rent, up 15.1% since this time last year.
–Escondido & La Mesa, CA rents tied for second fastest growing, both climbing 14.9% since last year.
–National City, CA had the third largest yearly growth rate, up 12.5%.
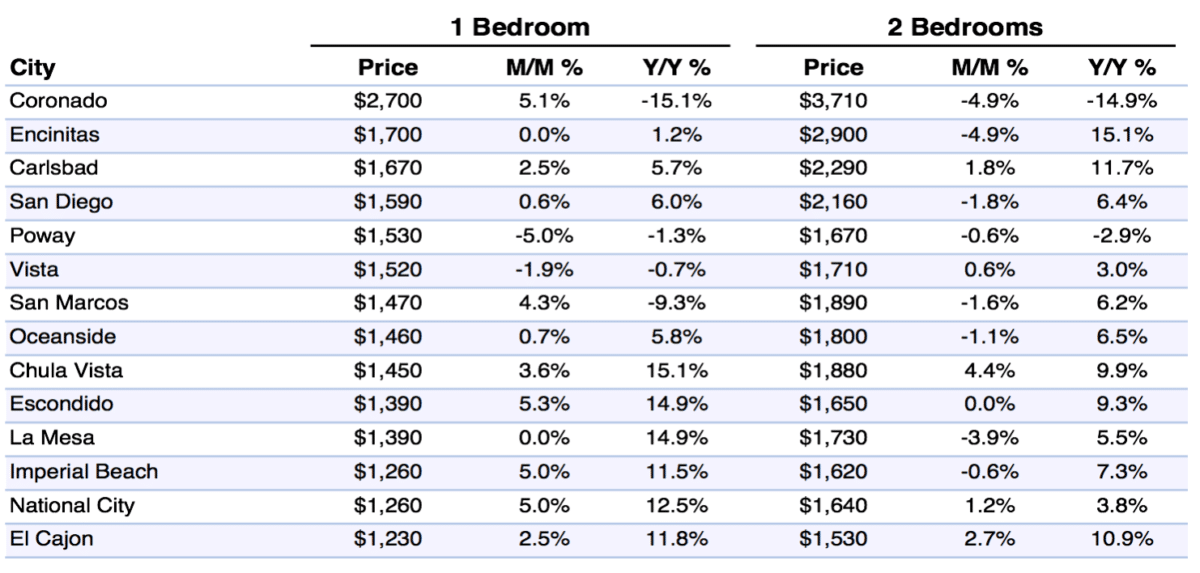
Full Data
| One Bedroom | Two Bedrooms | ||||||
|---|---|---|---|---|---|---|---|
| Pos. | City | Price | M/M % | Y/Y % | Price | M/M % | Y/Y % |
| 1 | San Francisco | $3,370 | 0.00% | -6.10% | $4,500 | 0.00% | -6.30% |
| 2 | Mountain View | $2,910 | 5.10% | -13.10% | $3,720 | 5.10% | 0.30% |
| 3 | Redwood City | $2,860 | -5.00% | -14.90% | $3,840 | -5.00% | -10.30% |
| 4 | Palo Alto | $2,770 | 3.40% | -10.40% | $4,190 | 5.00% | -13.60% |
| 5 | Sunnyvale | $2,650 | -4.70% | 1.90% | $3,260 | 1.60% | -1.80% |
| 6 | Emeryville | $2,560 | 4.90% | -15.00% | $3,600 | 1.70% | -7.20% |
| 7 | San Mateo | $2,490 | -0.40% | -7.10% | $3,390 | 0.90% | -6.90% |
| 8 | Berkeley | $2,480 | 3.30% | -13.00% | $3,410 | -3.70% | -9.30% |
| 9 | Santa Clara | $2,430 | 1.70% | -10.00% | $3,110 | 4.40% | -4.30% |
| 10 | South San Francisco | $2,400 | 4.30% | -5.90% | $3,410 | 0.30% | 2.70% |
| 11 | Burlingame | $2,370 | 0.00% | -9.50% | $3,240 | -0.30% | -15.00% |
| 11 | San Jose | $2,370 | 4.90% | 3.50% | $2,870 | 0.70% | -1.40% |
| 12 | Milpitas | $2,340 | 0.00% | 2.60% | $2,880 | 1.10% | 2.10% |
| 13 | Union City | $2,300 | 5.00% | -5.70% | $2,620 | -5.10% | 4.00% |
| 14 | Daly City | $2,260 | 0.90% | 0.90% | $2,830 | -3.70% | -4.10% |
| 15 | Pleasanton | $2,250 | 5.10% | -4.70% | $2,580 | 0.80% | -11.90% |
| 16 | Fremont | $2,190 | 0.90% | -3.10% | $2,500 | -2.00% | -6.40% |
| 17 | Walnut Creek | $2,150 | 1.90% | 0.00% | $2,640 | 1.50% | -9.00% |
| 18 | Petaluma | $2,140 | -2.30% | 12.60% | $2,380 | -0.40% | -2.50% |
| 19 | Oakland | $2,110 | 2.40% | -7.00% | $2,550 | 2.00% | -7.30% |
| 20 | San Ramon | $2,050 | 2.50% | -3.80% | $2,540 | 2.00% | 5.00% |
| 21 | Alameda | $1,920 | -4.50% | -15.00% | $2,620 | 4.80% | -14.90% |
| 22 | Hayward | $1,890 | 0.50% | 5.00% | $2,370 | 3.50% | 9.70% |
| 23 | Richmond | $1,820 | -0.50% | -6.20% | $2,040 | -1.00% | -10.10% |
| 24 | Livermore | $1,780 | 0.00% | -1.70% | $2,300 | -1.70% | -2.50% |
| 24 | San Leandro | $1,780 | 4.70% | 7.90% | $2,310 | 2.70% | 14.90% |
| 25 | Concord | $1,620 | 0.60% | 5.20% | $1,880 | -0.50% | 3.90% |
| 26 | Napa | $1,520 | 2.70% | 7.00% | $2,300 | 5.00% | 12.20% |
| 26 | Santa Rosa | $1,520 | -0.70% | 7.00% | $1,900 | 0.00% | -1.60% |
| 27 | Vallejo | $1,250 | -3.80% | 0.80% | $1,600 | -0.60% | 15.10% |
À propos
The Zumper San Diego Metro Report analyzed over 11,000 listings that hit the market in April 2017. Listings are aggregated by city to calculate median asking rents.
In the market for a new place? Search all San Diego apartments for rent on Zumper now.
Stay up to date with Zumper by following us on Facebook, Gazouillement, Instagram, & Pinterest.
Contenu associé


