The Zumper San Diego Metro Report analyzed active listings in May across 17 metro cities to show the most and least expensive cities and cities with the fastest growing rents. The California state median was $1,754 last month.
Cities Ranked By Rent
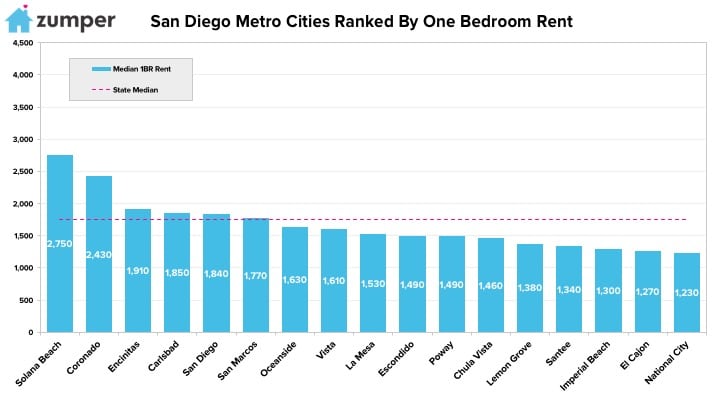
The Most Expensive
–Solana Beach, CA rent dropped $140 to $2,750 but remained the most expensive in the metro.
–Coronado, CA was second with rent at $2,430.
–Encinitas, CA moved up one spot, past Carlsbad and San Marcos, to rank as the third priciest city with rent at $1,910.
The Least Expensive
–National City, CA continued to rank as the most affordable city with one bedrooms priced at $1,230.
–El Cajon, CA rent fell one spot to become the second least expensive in the metro at $1,270.
– Imperial Beach, CA remained third with rent at $1,300.
Growth Rate
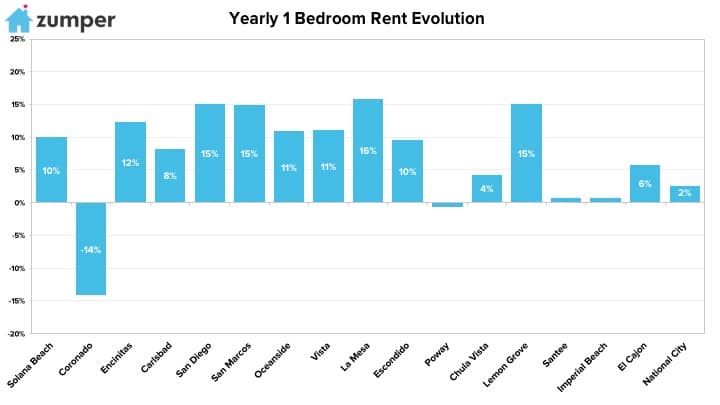
The Fastest Growing (Y/Y%)
–La Mesa, CA had the fastest growing rent, up 15.9% since this time last year.
–San Diego & Lemon Grove, CA tied for second with prices both growing 15%.
–San Marcos, CA followed closely behind as third with rent climbing 14.9%.
The Fastest Growing (M/M%)
–National City, CA had the largest monthly rental growth rate, up 5.1%.
–Encinitas & Escondido, CA rents tied for second fastest growing, both increasing 4.9% last month.
–Santee, CA was third with rent climbing 4.7%.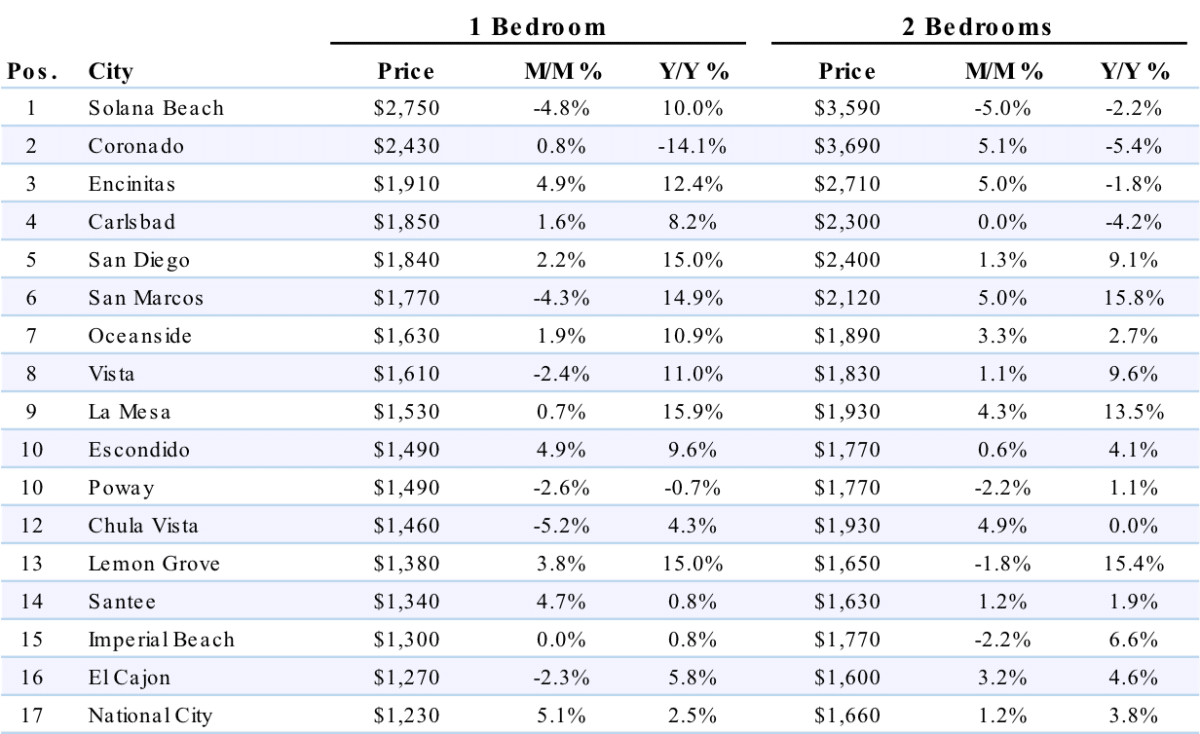
Full Data
| City | State | Region | Price Per Additional Room | Percentage of Income Spent on Rent | Monthly Housing Costs | Median Household Income | Current Unemployment | Infant Care Costs | Percentage of Population Under 45 | Highschool Dropout Rate | Average Commute Time | Violent Crime Rate | Score | Rank |
|---|---|---|---|---|---|---|---|---|---|---|---|---|---|---|
| Madison | WI | Midwest | 8.2 | 5.4 | 9.1 | 8.3 | 9.8 | 3.8 | 9.1 | 10.0 | 9.3 | 9.2 | 100.0 | 1.0 |
| Lincoln | NE | Midwest | 4.6 | 3.8 | 10.0 | 6.5 | 8.3 | 9.1 | 6.6 | 9.6 | 9.9 | 8.8 | 93.9 | 2.0 |
| Lexington | KY | South | 7.6 | 3.6 | 9.9 | 6.2 | 6.3 | 9.7 | 5.5 | 9.3 | 7.8 | 9.3 | 91.5 | 3.0 |
| Boise | ID | West | 9.6 | 2.4 | 9.3 | 7.1 | 8.9 | 9.3 | 2.6 | 6.2 | 9.9 | 9.5 | 91.0 | 4.0 |
| Tallahassee | FL | South | 8.5 | 9.7 | 6.8 | 2.8 | 6.6 | 6.4 | 10.0 | 9.2 | 9.9 | 2.1 | 87.6 | 5.0 |
| Raleigh | NC | South | 6.2 | 2.4 | 9.8 | 8.7 | 6.6 | 5.6 | 8.6 | 8.7 | 6.0 | 8.5 | 86.5 | 6.0 |
| Omaha | NE | Midwest | 5.4 | 3.3 | 8.9 | 6.3 | 8.0 | 9.1 | 4.4 | 7.7 | 9.3 | 7.6 | 85.2 | 7.0 |
| Des Moines | IA | Midwest | 10.0 | 3.6 | 8.9 | 4.9 | 9.8 | 5.7 | 5.8 | 5.9 | 9.3 | 4.7 | 83.5 | 8.0 |
| Austin | TX | South | 3.8 | 3.6 | 6.6 | 8.9 | 8.0 | 8.9 | 9.5 | 5.6 | 4.8 | 8.7 | 83.2 | 9.0 |
| Lubbock | TX | South | 6.2 | 7.1 | 8.9 | 4.2 | 8.0 | 8.9 | 8.7 | 3.6 | 10.0 | 2.7 | 83.1 | 10.0 |
| Charlotte | NC | South | 8.5 | 1.7 | 7.8 | 8.0 | 8.9 | 5.6 | 7.8 | 7.9 | 3.8 | 5.1 | 79.2 | 11.0 |
| Fort Worth | TX | South | 5.1 | 2.7 | 8.4 | 7.6 | 10.0 | 8.9 | 9.0 | 3.4 | 2.5 | 7.2 | 78.8 | 12.0 |
| Columbus | OH | Midwest | 3.5 | 1.4 | 8.2 | 4.7 | 9.5 | 7.4 | 8.6 | 7.4 | 7.1 | 7.0 | 78.8 | 13.0 |
| Virginia Beach | VA | South | 6.5 | 5.0 | 3.4 | 9.2 | 7.1 | 4.8 | 2.9 | 9.9 | 6.0 | 9.9 | 78.7 | 14.0 |
| Laredo | TX | South | 8.9 | 9.1 | 2.3 | 2.4 | 4.2 | 8.9 | 9.9 | 2.6 | 7.8 | 8.6 | 78.7 | 15.0 |
| Durham | NC | South | 6.9 | 2.9 | 9.2 | 6.9 | 6.3 | 5.6 | 7.8 | 8.2 | 6.0 | 4.0 | 77.6 | 16.0 |
| Norfolk | VA | South | 6.9 | 8.2 | 2.0 | 4.1 | 7.1 | 4.8 | 8.9 | 7.0 | 7.1 | 7.1 | 76.9 | 17.0 |
| Greensboro | NC | South | 9.2 | 4.3 | 6.2 | 3.3 | 8.4 | 5.6 | 3.9 | 7.3 | 8.5 | 6.1 | 76.4 | 18.0 |
| Bakersfield | CA | West | 8.2 | 6.1 | 4.1 | 8.8 | 0.6 | 2.1 | 9.4 | 8.6 | 6.0 | 7.8 | 75.1 | 19.0 |
| Colorado Springs | CO | West | 5.7 | 4.4 | 7.0 | 8.1 | 8.0 | 0.9 | 4.0 | 7.5 | 7.8 | 8.2 | 74.9 | 20.0 |
| Baton Rouge | LA | South | 9.5 | 9.0 | 5.7 | 2.6 | 1.9 | 10.0 | 6.3 | 5.7 | 7.1 | 3.8 | 74.9 | 21.0 |
| Arlington | TX | South | 4.1 | 5.4 | 8.4 | 7.3 | 5.5 | 8.9 | 7.1 | 4.3 | 2.5 | 7.7 | 74.5 | 22.0 |
| Plano | TX | South | 2.4 | 0.7 | 9.7 | 9.8 | 5.5 | 8.9 | 1.3 | 9.8 | 3.0 | 9.8 | 74.1 | 23.0 |
| Knoxville | TN | South | 8.9 | 5.4 | 7.1 | 1.3 | 8.2 | 7.0 | 5.0 | 6.0 | 8.5 | 3.2 | 73.7 | 24.0 |
| Syracuse | NY | Northeast | 7.3 | 8.7 | 9.5 | 1.0 | 2.1 | 2.6 | 7.0 | 6.9 | 9.9 | 4.2 | 72.0 | 25.0 |
| Augusta | GA | South | 9.2 | 7.8 | 3.9 | 2.3 | 4.2 | 9.5 | 3.9 | 0.7 | 8.5 | 9.1 | 71.9 | 26.0 |
| El Paso | TX | South | 8.2 | 2.9 | 5.3 | 3.7 | 2.1 | 8.9 | 6.3 | 6.5 | 6.0 | 8.9 | 71.5 | 27.0 |
| Chattanooga | TN | South | 9.7 | 4.3 | 6.6 | 3.0 | 7.1 | 7.0 | 1.1 | 7.6 | 9.3 | 2.5 | 70.8 | 28.0 |
| Minneapolis | MN | Midwest | 2.4 | 3.3 | 7.6 | 7.2 | 9.5 | 2.7 | 9.3 | 7.8 | 6.0 | 2.2 | 70.6 | 29.0 |
| Nashville | TN | South | 7.7 | 2.5 | 6.0 | 5.7 | 9.5 | 7.0 | 6.1 | 6.4 | 4.8 | 1.8 | 70.0 | 30.0 |
| San Antonio | TX | South | 4.1 | 3.7 | 6.7 | 5.2 | 7.1 | 8.9 | 6.6 | 3.8 | 4.8 | 6.5 | 69.8 | 31.0 |
| San Diego | CA | West | 1.2 | 6.9 | 1.9 | 9.3 | 7.5 | 2.1 | 5.8 | 9.5 | 4.8 | 8.4 | 69.8 | 32.0 |
| Irving | TX | South | 2.0 | 0.6 | 6.9 | 7.5 | 5.5 | 8.9 | 9.8 | 1.3 | 4.8 | 10.0 | 69.7 | 33.0 |
| Anchorage | AK | West | 5.4 | 2.0 | 7.7 | 9.7 | 0.8 | 5.1 | 6.7 | 8.3 | 9.3 | 2.0 | 69.3 | 34.0 |
| Rochester | NY | Northeast | 7.3 | 9.5 | 5.6 | 0.9 | 9.8 | 2.6 | 7.4 | 1.4 | 8.5 | 3.7 | 69.0 | 35.0 |
| Winston Salem | NC | South | 10.0 | 6.1 | 7.3 | 2.7 | 4.6 | 5.6 | 3.1 | 2.8 | 8.5 | 5.9 | 68.9 | 36.0 |
| Louisville | KY | South | 8.9 | 2.4 | 9.0 | 4.5 | 2.6 | 9.7 | 1.2 | 5.3 | 7.1 | 5.7 | 68.6 | 37.0 |
| Salt Lake City | UT | West | 3.0 | 2.1 | 7.4 | 5.9 | 8.2 | 1.0 | 9.2 | 7.2 | 8.5 | 3.9 | 68.6 | 38.0 |
| Oklahoma City | OK | Midwest | 8.5 | 1.7 | 8.5 | 5.8 | 4.2 | 7.6 | 5.6 | 2.1 | 7.8 | 4.4 | 68.4 | 39.0 |
| Richmond | VA | South | 5.1 | 8.2 | 3.7 | 2.9 | 7.4 | 4.8 | 4.8 | 4.0 | 7.1 | 7.5 | 67.5 | 40.0 |
| San Jose | CA | West | 1.4 | 5.7 | 2.2 | 10.0 | 9.5 | 2.1 | 3.9 | 8.5 | 2.0 | 9.4 | 66.5 | 41.0 |
| Portland | OR | West | 3.2 | 5.5 | 4.0 | 8.5 | 8.9 | 2.2 | 4.2 | 7.1 | 3.0 | 8.0 | 66.4 | 42.0 |
| Providence | RI | Northeast | 9.3 | 7.2 | 1.8 | 1.9 | 2.6 | 4.3 | 9.6 | 5.0 | 6.0 | 6.8 | 66.3 | 43.0 |
| Orlando | FL | South | 4.6 | 7.8 | 3.3 | 3.8 | 7.4 | 6.4 | 8.1 | 6.1 | 3.8 | 3.1 | 66.2 | 44.0 |
| Corpus Christi | TX | South | 4.6 | 1.5 | 7.6 | 7.0 | 1.2 | 8.9 | 3.4 | 4.9 | 9.3 | 5.5 | 65.6 | 45.0 |
| Anaheim | CA | West | 1.7 | 9.2 | 1.4 | 9.0 | 3.5 | 2.1 | 6.6 | 9.4 | 2.0 | 9.0 | 65.6 | 46.0 |
| Santa Ana | CA | West | 2.4 | 9.8 | 1.0 | 7.4 | 1.7 | 2.1 | 9.7 | 8.1 | 3.8 | 7.9 | 65.6 | 47.0 |
| Aurora | CO | West | 3.3 | 7.6 | 5.8 | 7.9 | 9.5 | 0.9 | 6.8 | 2.0 | 1.7 | 8.1 | 65.2 | 48.0 |
| Pittsburgh | PA | Northeast | 4.2 | 3.3 | 9.7 | 3.2 | 4.2 | 4.5 | 4.4 | 8.9 | 6.0 | 4.9 | 64.8 | 49.0 |
| Sacramento | CA | West | 5.4 | 7.1 | 3.2 | 6.8 | 6.3 | 2.1 | 5.5 | 8.4 | 3.8 | 4.6 | 64.7 | 50.0 |
| Indianapolis | IN | Midwest | 8.2 | 6.3 | 8.9 | 3.5 | 7.4 | 3.0 | 5.0 | 3.3 | 6.0 | 1.4 | 64.5 | 51.0 |
| Wichita | KS | Midwest | 8.2 | 1.2 | 9.5 | 4.4 | 6.3 | 3.2 | 3.2 | 4.5 | 9.9 | 2.6 | 64.5 | 52.0 |
| Shreveport | LA | South | 9.2 | 8.2 | 5.9 | 2.2 | 1.0 | 10.0 | 2.1 | 0.6 | 9.3 | 4.1 | 64.0 | 53.0 |
| Milwaukee | WI | Midwest | 5.7 | 8.4 | 2.9 | 1.6 | 8.0 | 3.8 | 8.6 | 5.1 | 7.1 | 0.9 | 63.4 | 54.0 |
| Tampa | FL | South | 5.1 | 7.3 | 3.6 | 4.3 | 6.3 | 6.4 | 3.9 | 4.4 | 4.8 | 5.8 | 63.1 | 55.0 |
| Atlanta | GA | South | 2.8 | 4.6 | 4.7 | 5.6 | 5.5 | 9.5 | 7.8 | 6.6 | 3.0 | 1.6 | 62.9 | 56.0 |
| Scottsdale | AZ | West | 1.0 | 0.8 | 4.2 | 9.6 | 5.5 | 4.2 | 0.6 | 9.0 | 7.1 | 9.6 | 62.8 | 57.0 |
| Akron | OH | Midwest | 7.3 | 6.3 | 6.2 | 1.5 | 2.3 | 7.4 | 1.4 | 4.6 | 7.8 | 6.4 | 62.3 | 58.0 |
| Mesa | AZ | West | 6.9 | 5.1 | 6.3 | 6.1 | 5.5 | 4.2 | 1.7 | 3.1 | 3.8 | 8.3 | 62.0 | 59.0 |
| Henderson | NV | West | 6.5 | 1.2 | 4.6 | 9.1 | 1.5 | 3.5 | 0.9 | 8.0 | 6.0 | 9.7 | 62.0 | 60.0 |
| Fresno | CA | West | 6.2 | 9.6 | 2.8 | 3.1 | 0.7 | 2.1 | 8.9 | 3.0 | 7.1 | 6.9 | 61.3 | 61.0 |
| Boston | MA | Northeast | 2.1 | 4.8 | 2.7 | 8.6 | 7.1 | 0.6 | 8.3 | 9.7 | 1.6 | 4.8 | 61.2 | 62.0 |
| Jacksonville | FL | South | 7.6 | 6.9 | 4.4 | 5.3 | 3.0 | 6.4 | 2.2 | 4.2 | 4.8 | 5.4 | 61.1 | 63.0 |
| Memphis | TN | South | 10.0 | 8.6 | 2.7 | 1.8 | 3.0 | 7.0 | 5.2 | 3.9 | 7.1 | 0.8 | 60.9 | 64.0 |
| Reno | NV | West | 2.6 | 4.0 | 4.9 | 5.4 | 6.3 | 3.5 | 2.4 | 5.2 | 9.3 | 6.3 | 60.7 | 65.0 |
| Fort Lauderdale | FL | South | 1.5 | 8.8 | 1.1 | 6.7 | 10.0 | 6.4 | 0.8 | 3.2 | 3.0 | 7.3 | 59.4 | 66.0 |
| Kansas City | MO | Midwest | 7.6 | 2.0 | 8.2 | 4.8 | 4.2 | 6.6 | 3.3 | 3.7 | 7.1 | 1.2 | 59.2 | 67.0 |
| Phoenix | AZ | West | 5.1 | 4.3 | 4.8 | 5.5 | 5.5 | 4.2 | 7.3 | 1.6 | 3.8 | 6.2 | 58.8 | 68.0 |
| Albuquerque | NM | West | 6.2 | 6.1 | 5.1 | 5.0 | 3.0 | 7.7 | 2.0 | 2.3 | 7.8 | 2.9 | 58.5 | 69.0 |
| Cincinnati | OH | Midwest | 4.3 | 4.5 | 5.2 | 1.4 | 4.2 | 7.4 | 6.1 | 5.5 | 6.0 | 3.3 | 58.3 | 70.0 |
| Spokane | WA | West | 6.9 | 6.9 | 4.6 | 3.6 | 1.0 | 2.9 | 1.9 | 4.1 | 8.5 | 7.4 | 58.2 | 71.0 |
| Washington | DC | Northeast | 1.1 | 2.7 | 7.2 | 9.4 | 6.6 | 3.6 | 7.2 | 6.7 | 1.6 | 1.5 | 57.9 | 72.0 |
| Tucson | AZ | West | 5.1 | 8.2 | 4.4 | 2.1 | 4.2 | 4.2 | 4.6 | 2.4 | 7.1 | 5.3 | 57.9 | 73.0 |
| Tulsa | OK | Midwest | 7.3 | 1.4 | 7.9 | 3.4 | 2.6 | 7.6 | 2.9 | 0.9 | 9.9 | 3.6 | 57.8 | 74.0 |
| Denver | CO | West | 0.9 | 3.3 | 6.4 | 8.2 | 9.5 | 0.9 | 7.5 | 0.8 | 3.8 | 5.2 | 56.6 | 75.0 |
| Seattle | WA | West | 1.3 | 1.0 | 5.4 | 9.5 | 3.0 | 2.9 | 5.2 | 8.8 | 2.5 | 6.0 | 55.5 | 76.0 |
| St Petersburg | FL | South | 1.8 | 5.7 | 3.1 | 5.1 | 6.3 | 6.4 | 0.7 | 5.8 | 6.0 | 4.5 | 55.2 | 77.0 |
| Long Beach | CA | West | 1.7 | 7.5 | 1.2 | 7.7 | 3.5 | 2.1 | 6.1 | 6.8 | 1.6 | 6.7 | 54.6 | 78.0 |
| New Orleans | LA | South | 6.2 | 9.4 | 1.7 | 2.0 | 1.5 | 10.0 | 2.4 | 2.9 | 4.8 | 3.0 | 53.4 | 79.0 |
| Dallas | TX | South | 2.0 | 2.0 | 3.8 | 4.0 | 5.5 | 8.9 | 8.2 | 1.5 | 3.0 | 5.0 | 53.4 | 80.0 |
| Houston | TX | South | 2.8 | 3.9 | 5.1 | 4.6 | 1.9 | 8.9 | 8.0 | 1.8 | 2.5 | 2.8 | 51.5 | 81.0 |
| Los Angeles | CA | West | 0.7 | 9.4 | 0.8 | 6.6 | 3.5 | 2.1 | 5.5 | 6.3 | 1.3 | 5.6 | 50.9 | 82.0 |
| St Louis | MO | Midwest | 3.2 | 6.1 | 5.5 | 1.7 | 6.3 | 6.6 | 3.9 | 2.7 | 4.8 | 0.6 | 50.4 | 83.0 |
| New York | NY | Northeast | 2.9 | 6.9 | 0.9 | 7.8 | 4.6 | 2.6 | 2.9 | 5.4 | 0.6 | 6.6 | 50.1 | 84.0 |
| Chicago | IL | Midwest | 3.4 | 4.8 | 2.1 | 6.0 | 5.5 | 3.2 | 6.9 | 4.8 | 0.8 | 3.5 | 49.9 | 85.0 |
| Oakland | CA | West | 2.6 | 6.9 | 1.7 | 8.4 | 8.9 | 2.1 | 4.2 | 3.5 | 1.3 | 1.1 | 49.5 | 86.0 |
| Newark | NJ | Northeast | 3.8 | 8.9 | 0.6 | 1.1 | 4.6 | 9.2 | 7.9 | 1.9 | 0.7 | 1.9 | 49.4 | 87.0 |
| Buffalo | NY | Northeast | 4.1 | 7.5 | 8.0 | 1.2 | 1.7 | 2.6 | 4.7 | 1.1 | 7.8 | 1.7 | 49.1 | 88.0 |
| San Francisco | CA | West | 0.6 | 0.9 | 1.7 | 9.9 | 8.9 | 2.1 | 1.5 | 9.1 | 1.0 | 4.3 | 48.7 | 89.0 |
| Philadelphia | PA | Northeast | 5.7 | 8.5 | 2.5 | 2.5 | 3.5 | 4.5 | 4.6 | 4.7 | 0.9 | 2.3 | 48.3 | 90.0 |
| Cleveland | OH | Midwest | 8.9 | 8.4 | 2.4 | 0.7 | 1.2 | 7.4 | 1.6 | 1.7 | 4.8 | 1.3 | 46.7 | 91.0 |
| Las Vegas | NV | West | 6.5 | 5.0 | 3.5 | 6.4 | 1.5 | 3.5 | 1.8 | 2.5 | 3.8 | 3.4 | 46.1 | 92.0 |
| Detroit | MI | Midwest | 9.5 | 10.0 | 1.3 | 0.6 | 3.5 | 5.0 | 2.6 | 1.0 | 2.5 | 0.7 | 44.6 | 93.0 |
| Baltimore | MD | Northeast | 3.8 | 6.4 | 3.0 | 3.9 | 2.3 | 4.9 | 3.0 | 2.2 | 1.3 | 1.0 | 38.7 | 94.0 |
About
The Zumper San Diego Metro Report analyzed active listings that hit the market last month. Listings are aggregated by city to calculate median asking rents.
In the market for a new place? Search all San Diego apartments for rent on Zumper now.
Stay up to date with Zumper by following us on Facebook, Gazouillement, Instagram, & Pinterest.
Contenu associé