The Zumper San Diego Metro Report analyzed active listings in June across 15 metro cities to show the most and least expensive cities and cities with the fastest growing rents.
Cities Ranked By Rent
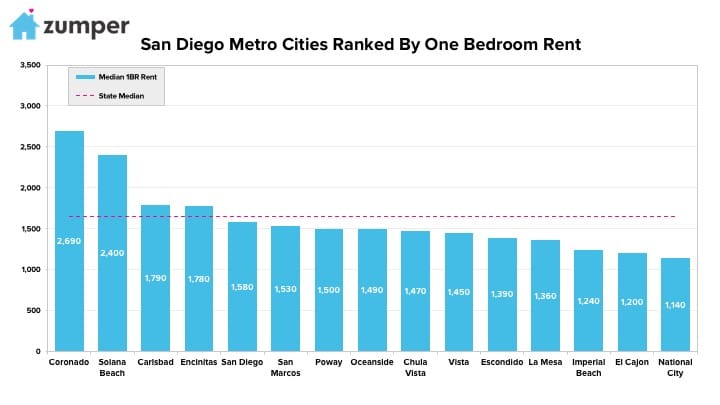
Le plus cher
–Coronado, CA rent fell $140 since last month to $2,690 but held onto its position as the most expensive in the metro.
–Solana Beach, CA was the second most expensive city to rent with one bedroom units priced at $2,400.
–Carlsbad, CA ranked as third with rent at $1,790.
Le moins cher
–National City, CA rent fell $60 since last month but continued to be the most affordable in the metro.
–El Cajon, CA was second with rent at $1,200.
–Imperial Beach, CA ranked as third at $1,240.
Growth Rate
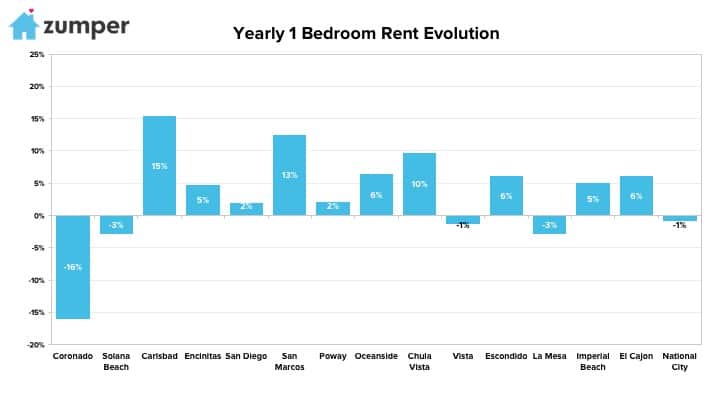
La croissance la plus rapide (Y/Y%)
–Carlsbad, CA had the fastest growing rent, up a whopping 15.5% since this time last year.
–San Marcos, CA saw a 12.5% increase in rent, making it second.
–Chula Vista, CA had the third largest yearly growth rate, climbing 9.7%.
La croissance la plus rapide (M/M%)
–Chula Vista, CA also had a huge monthly growth rate, up 5%.
–Carlsbad & Encinitas, CA tied for second with rents jumping 4.7%.
–Solana Beach, CA was third with rent growing 4.3%.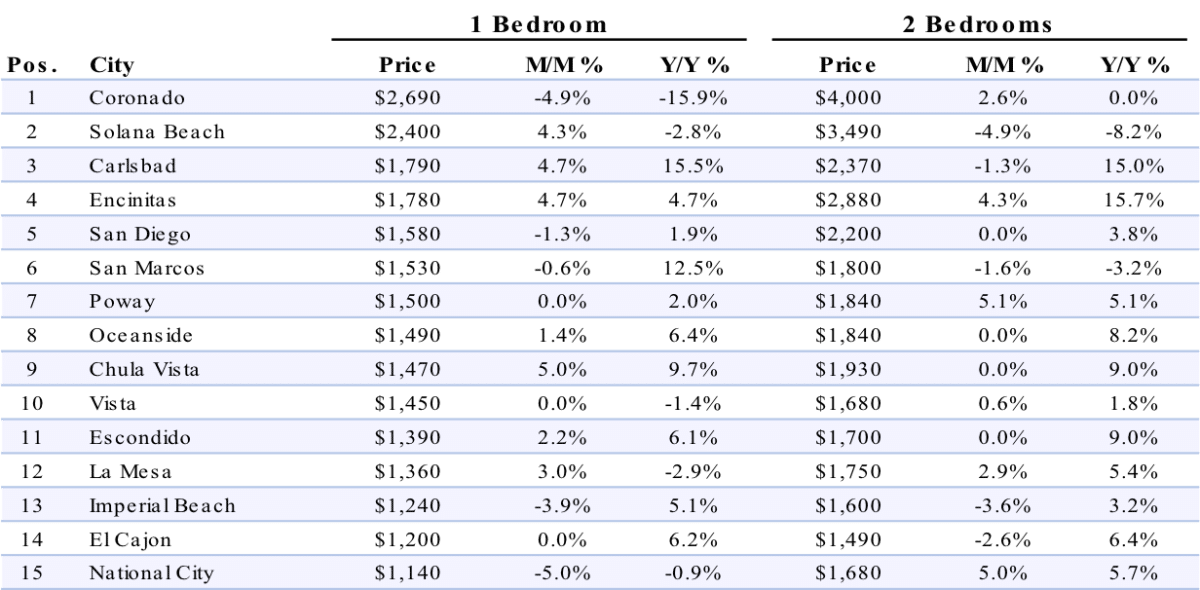
Full Data
| One Bedroom | Two Bedrooms | ||||||
|---|---|---|---|---|---|---|---|
| Pos. | City | Price | M/M % | Y/Y % | Price | M/M % | Y/Y % |
| 1 | Santa Monica | $3,110 | 5.10% | 4.00% | $4,200 | 5.00% | -3.20% |
| 2 | Los Angeles | $2,150 | 2.40% | 8.00% | $3,100 | 3.30% | 2.60% |
| 2 | Pasadena | $2,150 | -1.80% | -2.70% | $2,670 | 2.70% | -4.30% |
| 3 | Glendale | $2,100 | 5.00% | -5.80% | $2,770 | 4.10% | -5.80% |
| 4 | Culver City | $2,030 | 5.20% | 1.50% | $2,910 | -3.30% | 11.90% |
| 5 | Burbank | $1,880 | 5.00% | 2.20% | $2,400 | 0.00% | 2.10% |
| 6 | Santa Clarita | $1,710 | -0.60% | -1.20% | $2,130 | 4.90% | 8.70% |
| 7 | Alhambra | $1,600 | -3.00% | 13.50% | $2,030 | 2.50% | 7.40% |
| 8 | Torrance | $1,570 | 1.30% | -0.60% | $2,090 | -3.20% | 5.60% |
| 9 | West Covina | $1,510 | 0.70% | 15.30% | $1,790 | -0.60% | 8.50% |
| 10 | Downey | $1,360 | 3.80% | 10.60% | $1,760 | 0.00% | 8.00% |
| 10 | Norwalk | $1,360 | -2.20% | 9.70% | $1,710 | -5.00% | 14.80% |
| 11 | Inglewood | $1,350 | 0.00% | 9.80% | $1,780 | 1.10% | 14.80% |
| 12 | Hawthorne | $1,300 | 0.00% | 13.00% | $1,660 | -1.80% | 10.70% |
| 12 | Whittier | $1,300 | 4.00% | 7.40% | $1,660 | -5.10% | 4.40% |
| 13 | Pomona | $1,280 | 4.90% | 5.80% | $1,600 | 5.30% | 8.10% |
| 14 | Bellflower | $1,270 | 5.00% | 7.60% | $1,550 | -2.50% | 3.30% |
| 15 | Palmdale | $690 | 4.50% | 6.20% | $1,120 | 4.70% | -0.90% |
À propos
The Zumper San Diego Metro Report analyzed active listings that hit the market in June 2017. Listings are aggregated by city to calculate median asking rents. This report focuses on apartments for rent in San Diego.
In the market for a new place? Search all San Diego apartments for rent on Zumper now.
Stay up to date with Zumper by following us on Facebook, Gazouillement, Instagram, & Pinterest.
Contenu associé


