The Zumper San Diego Metro Report analyzed active listings in July 2019 across 17 metro cities to show the most and least expensive cities and cities with the fastest growing rents. The California state median was $1,799 last month.
Cities Ranked By Rent
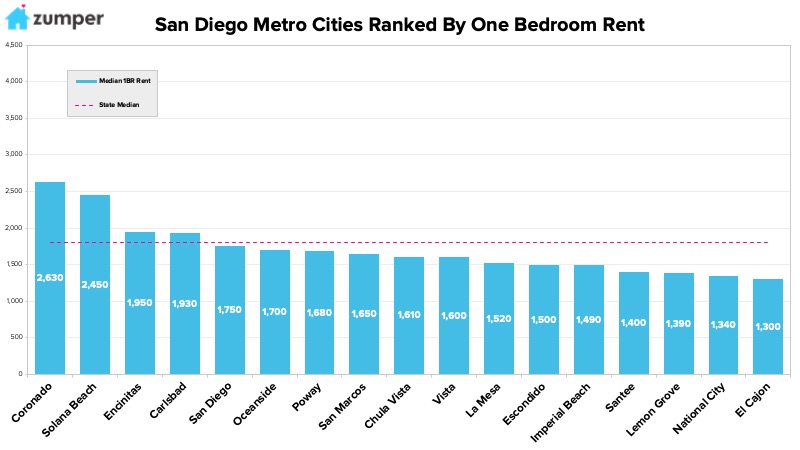
The Most Expensive
–Coronado, CA continued to rank as the most expensive city with rent at $2,630.
–Solana Beach, CA was second with one bedrooms priced at $2,450.
–Encinitas, CA moved into the top 3 with rent growing $50 to $1,950.
The Least Expensive
–El Cajon, CA saw rent drop $10 to $1,300 but remain the most affordable city.
–National City, CA ranked as the second least expensive with rent at $1,340.
–Lemon Grove, CA was third with rent at $1,390.
Growth Rate
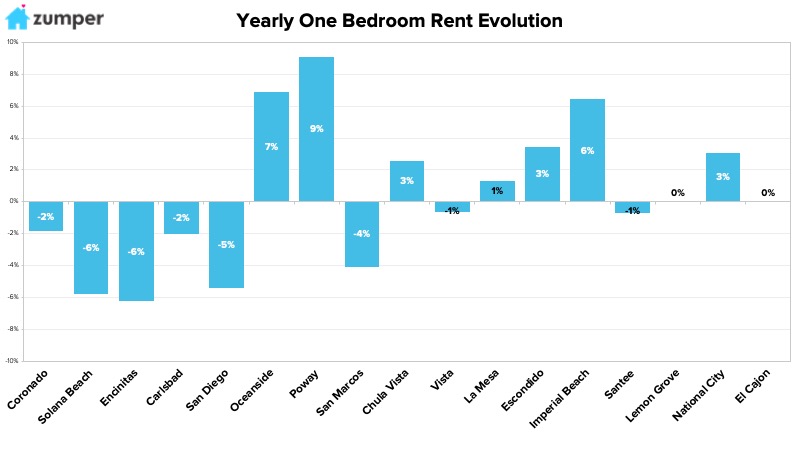
The Fastest Growing (Y/Y%)
–Poway, CA had the fastest growing rent, up 9.1% since this time last year.
–Oceanside, CA saw rent climb 6.9%, making it second.
–Imperial Beach, CA followed closely behind as third with rent growing 6.4%.
The Fastest Growing (M/M%)
–Vista, CA rent had the largest monthly growth rate, up 5.3%.
–Chula Vista, CA had the second fastest growing rent last month, jumping 5.2%.
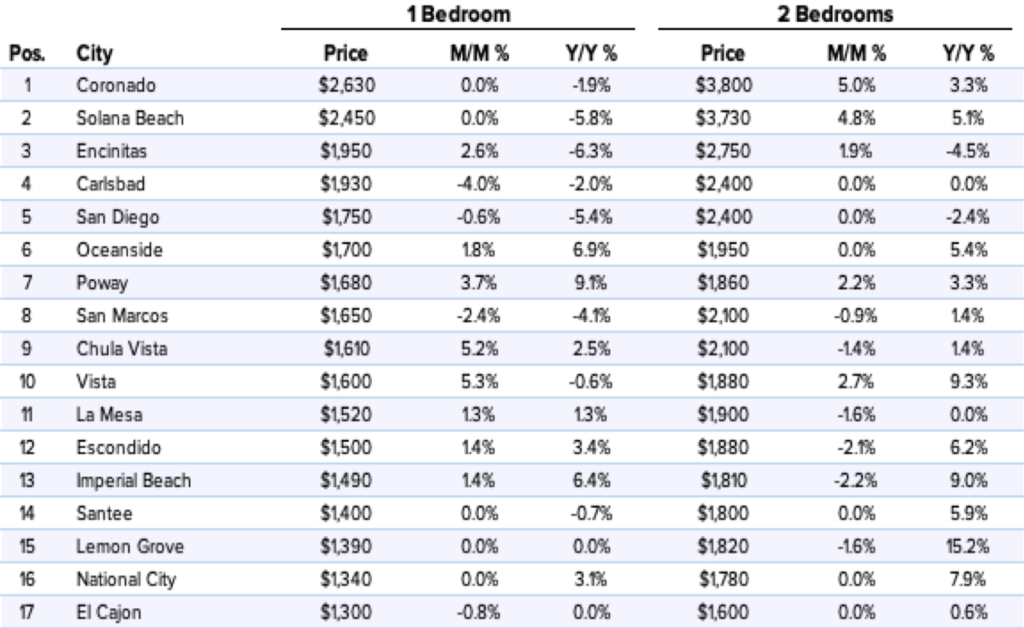
Full Data
| 1 Bedroom | 2 Bedrooms | ||||||
|---|---|---|---|---|---|---|---|
| Pos. | City | Price | M/M % | Y/Y % | Price | M/M % | Y/Y % |
| 1 | Coronado | $2,630 | 0.00% | -1.90% | $3,800 | 5.00% | 3.30% |
| 2 | Solana Beach | $2,450 | 0.00% | -5.80% | $3,730 | 4.80% | 5.10% |
| 3 | Encinitas | $1,950 | 2.60% | -6.30% | $2,750 | 1.90% | -4.50% |
| 4 | Carlsbad | $1,930 | -4.00% | -2.00% | $2,400 | 0.00% | 0.00% |
| 5 | San Diego | $1,750 | -0.60% | -5.40% | $2,400 | 0.00% | -2.40% |
| 6 | Oceanside | $1,700 | 1.80% | 6.90% | $1,950 | 0.00% | 5.40% |
| 7 | Poway | $1,680 | 3.70% | 9.10% | $1,860 | 2.20% | 3.30% |
| 8 | San Marcos | $1,650 | -2.40% | -4.10% | $2,100 | -0.90% | 1.40% |
| 9 | Chula Vista | $1,610 | 5.20% | 2.50% | $2,100 | -1.40% | 1.40% |
| 10 | Vista | $1,600 | 5.30% | -0.60% | $1,880 | 2.70% | 9.30% |
| 11 | La Mesa | $1,520 | 1.30% | 1.30% | $1,900 | -1.60% | 0.00% |
| 12 | Escondido | $1,500 | 1.40% | 3.40% | $1,880 | -2.10% | 6.20% |
| 13 | Imperial Beach | $1,490 | 1.40% | 6.40% | $1,810 | -2.20% | 9.00% |
| 14 | Santee | $1,400 | 0.00% | -0.70% | $1,800 | 0.00% | 5.90% |
| 15 | Lemon Grove | $1,390 | 0.00% | 0.00% | $1,820 | -1.60% | 15.20% |
| 16 | National City | $1,340 | 0.00% | 3.10% | $1,780 | 0.00% | 7.90% |
| 17 | El Cajon | $1,300 | -0.80% | 0.00% | $1,600 | 0.00% | 0.60% |
About
The Zumper San Diego Metro Report analyzed active listings that hit the market last month. Listings are aggregated by city to calculate median asking rents.
In the market for a new place? Search all San Diego apartments for rent on Zumper now.
Stay up to date with Zumper by following us on Facebook, Gazouillement, Instagram, & Pinterest.
Contenu associé