The Zumper San Diego Metro Report analyzed active listings in July across 17 metro cities to show the most and least expensive cities and cities with the fastest growing rents. The California state median was $1,757 last month.
Cities Ranked By Rent
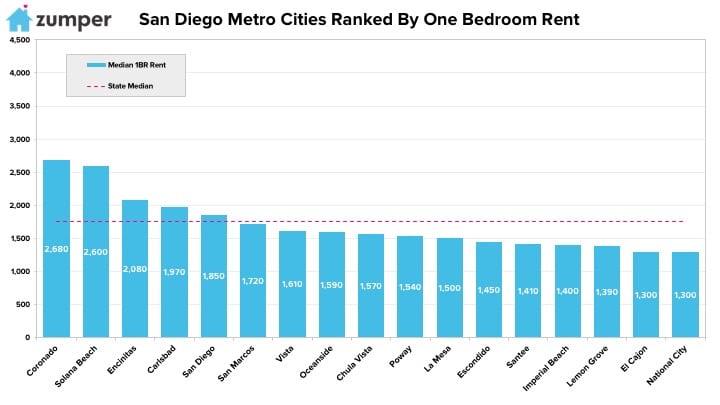
Le plus cher
–Coronado, CA moved up 1 spot to reclaim its position as the most expensive city again with one rent growing $130 to $2,680.
–Solana Beach, CA fell to second with the price of one bedrooms decreasing $10 to $2,600.
–Encinitas, CA remained third with rent at $2,080.
Le moins cher
–National City & El Cajon, CA were tied for the most affordable city in the metro, both with prices at $1,300.
–Lemon Grove, CA fell 3 spots to rank as the second least expensive city with rent at $1,390.
–Imperial Beach, CA dropped 1 spot to become third with rent at $1,400.
Growth Rate
La croissance la plus rapide (Y/Y%)
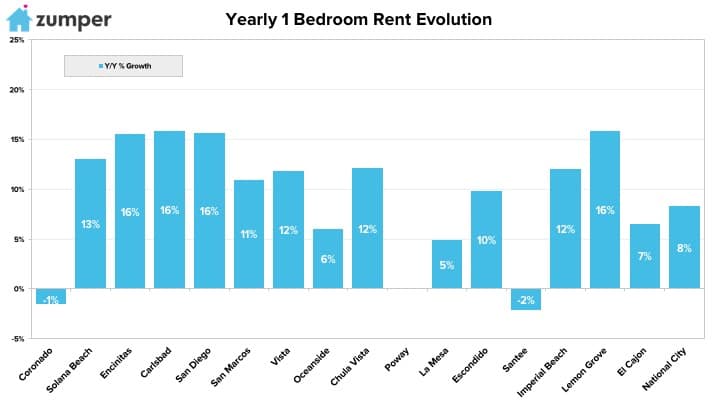
–Carlsbad, CA had the fastest growing rent, up 15.9% since this time last year.
–Lemon Grove, CA followed closely behind as second with rent climbing 15.8%.
–Encinitas, CA rent jumped 15.6%, making it third.
La croissance la plus rapide (M/M%)
–Coronado, CA rent had the largest monthly growth rate, up 5.1%.
–Chula Vista, CA was second with rent jumping 4.7% last month.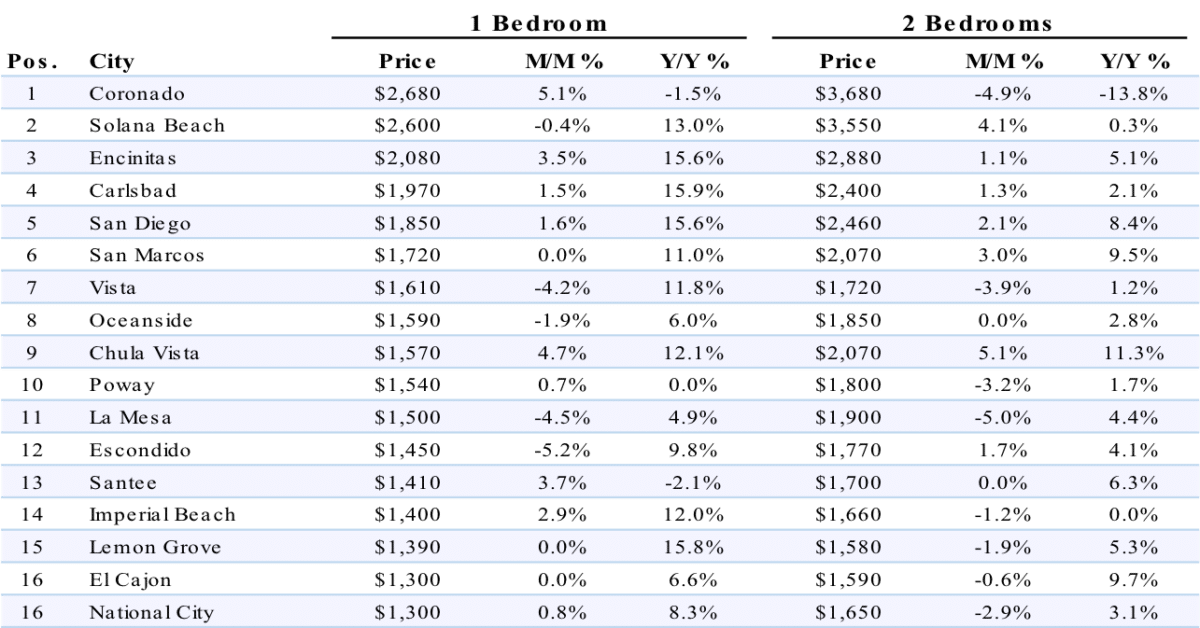
Full Data
| 1 Bedroom | 2 Bedrooms | ||||||
|---|---|---|---|---|---|---|---|
| Pos. | City | Price | M/M % | Y/Y % | Price | M/M % | Y/Y % |
| 1 | Coronado | $2,680 | 5.10% | -1.50% | $3,680 | -4.90% | -13.80% |
| 2 | Solana Beach | $2,600 | -0.40% | 13.00% | $3,550 | 4.10% | 0.30% |
| 3 | Encinitas | $2,080 | 3.50% | 15.60% | $2,880 | 1.10% | 5.10% |
| 4 | Carlsbad | $1,970 | 1.50% | 15.90% | $2,400 | 1.30% | 2.10% |
| 5 | San Diego | $1,850 | 1.60% | 15.60% | $2,460 | 2.10% | 8.40% |
| 6 | San Marcos | $1,720 | 0.00% | 11.00% | $2,070 | 3.00% | 9.50% |
| 7 | Vista | $1,610 | -4.20% | 11.80% | $1,720 | -3.90% | 1.20% |
| 8 | Oceanside | $1,590 | -1.90% | 6.00% | $1,850 | 0.00% | 2.80% |
| 9 | Chula Vista | $1,570 | 4.70% | 12.10% | $2,070 | 5.10% | 11.30% |
| 10 | Poway | $1,540 | 0.70% | 0.00% | $1,800 | -3.20% | 1.70% |
| 11 | La Mesa | $1,500 | -4.50% | 4.90% | $1,900 | -5.00% | 4.40% |
| 12 | Escondido | $1,450 | -5.20% | 9.80% | $1,770 | 1.70% | 4.10% |
| 13 | Santee | $1,410 | 3.70% | -2.10% | $1,700 | 0.00% | 6.30% |
| 14 | Imperial Beach | $1,400 | 2.90% | 12.00% | $1,660 | -1.20% | 0.00% |
| 15 | Lemon Grove | $1,390 | 0.00% | 15.80% | $1,580 | -1.90% | 5.30% |
| 16 | El Cajon | $1,300 | 0.00% | 6.60% | $1,590 | -0.60% | 9.70% |
| 16 | National City | $1,300 | 0.80% | 8.30% | $1,650 | -2.90% | 3.10% |
À propos
The Zumper San Diego Metro Report analyzed active listings that hit the market last month. Listings are aggregated by city to calculate median asking rents.
In the market for a new place? Search all San Diego apartments for rent on Zumper now.
Stay up to date with Zumper by following us on Facebook, Gazouillement, Instagram, & Pinterest.
Contenu associé


