Le tout premier rapport Zumper sur la région métropolitaine de Salt Lake City a analysé les annonces immobilières actives en septembre dans 11 villes métropolitaines afin d'établir le classement des villes les plus et les moins chères, ainsi que celles où les loyers ont connu la plus forte croissance. Le loyer médian dans l'Utah était de 1 448 420 $ le mois dernier.
Classement des villes par loyer
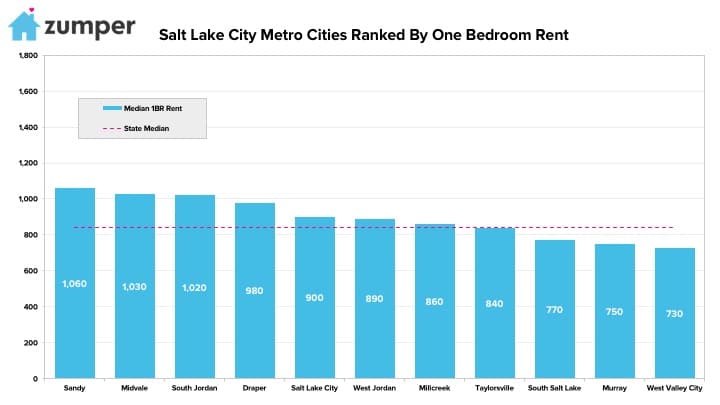
Le plus cher
–Sandy, Utah était la ville la plus chère de la métropole, avec des appartements d'une chambre à coucher à 1 TP4 000 ₹.
–Midvale, Utah Le loyer était le deuxième plus cher à $1,030.
–South Jordan, Utah suivi de près en troisième position avec un loyer de $1,020.
Le moins cher
–West Valley City, Utah Il proposait le loyer le plus abordable de la métropole, à $730.
–Murray, Utah classée deuxième ville la moins chère avec un loyer de $750.
–South Salt Lake, Utah était troisième à $770.
taux de croissance
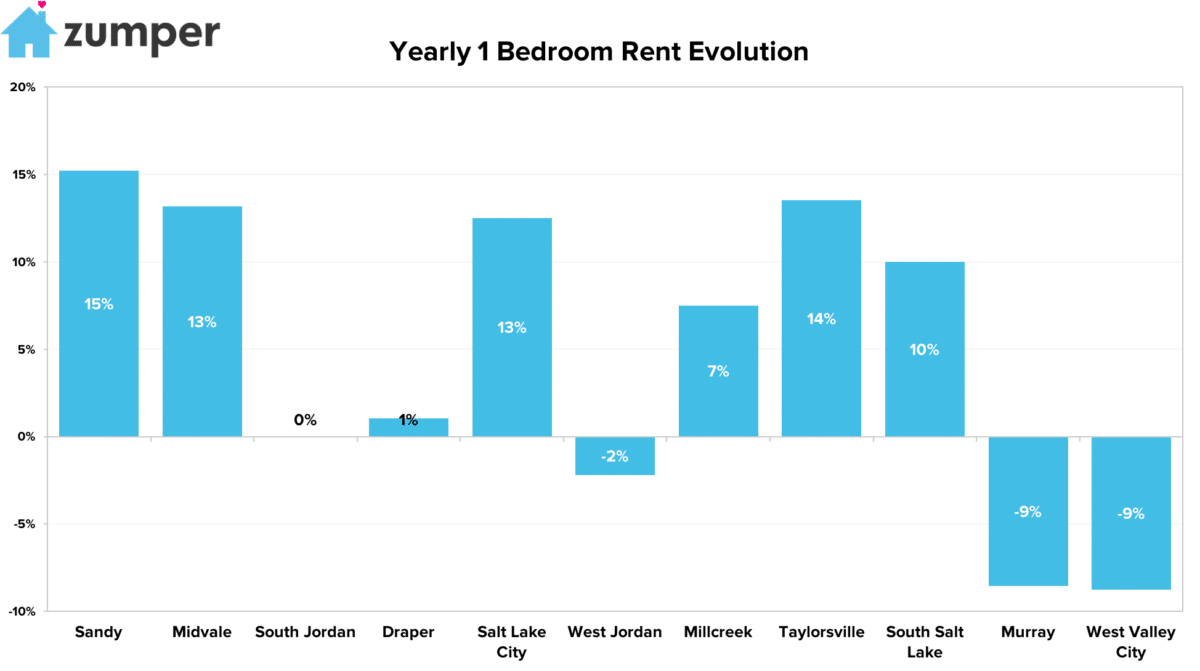
La croissance la plus rapide (Y/Y%)
–Sandy, Utah, en plus d'avoir le loyer le plus cher, a également connu le taux de croissance annuel des loyers le plus élevé, en hausse de 15%.
–Taylorsville, Utah a enregistré la deuxième plus forte croissance des loyers depuis l'an dernier à la même époque, avec une hausse de 13,51 TP3T.
–Midvale, Utah se classait troisième avec une croissance des loyers de 13,2%.
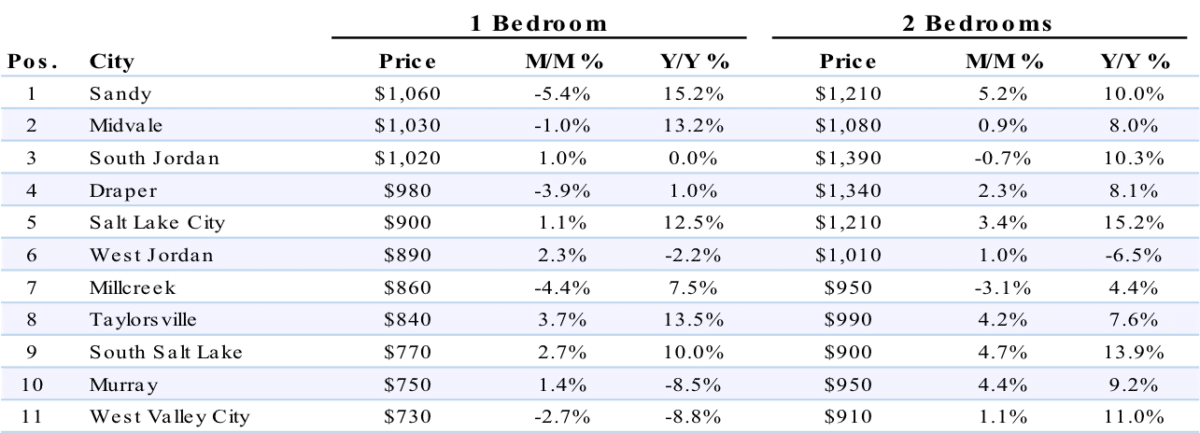
Données complètes
1 chambre 2 chambres
Pos. Ville Prix M/M % Y/Y % Prix M/M % Y/Y %
1 San Francisco $3,420 -1.70% 1.20% $4,500 0.00% -3.60%
2 Vue sur la montagne $3,110 0.00% 9.50% $3,510 -3.80% 4.20%
3 Emeryville $2,660 -0.70% 0.40% $3,580 1.10% 10.80%
3 Ville de Redwood $2,660 -5.00% -7.30% $3,340 -5.10% -9.00%
5 Palo Alto $2,650 0.00% 3.50% $3,710 -4.90% -3.40%
6 Sunnyvale $2,640 0.00% 6.00% $3,010 -3.20% -1.00%
7 San Mateo $2,490 0.80% -1.60% $3,370 -0.60% 10.10%
8 Berkeley $2,480 -0.80% -15.90% $3,000 -4.80% 0.00%
9 Milpitas $2,400 -2.80% 6.20% $2,500 -2.00% -6.40%
10 Daly City $2,390 -0.40% 2.60% $3,130 -1.90% 4.30%
11 Burlingame $2,370 2.60% -2.10% $3,370 -2.60% 15.80%
12 San José $2,360 -1.30% 6.80% $2,730 -1.10% 1.50%
13 Santa Clara $2,340 -0.80% 2.20% $2,870 -1.70% 5.10%
13 Walnut Creek $2,340 -2.10% 9.90% $2,660 -5.00% 6.80%
15 Pleasanton $2,180 0.50% -0.90% $2,540 -4.20% 3.30%
16 Fremont $2,170 -0.90% 2.80% $2,550 0.80% -0.80%
16 Sud de San Francisco $2,170 4.80% 3.30% $3,250 -5.00% 8.30%
18 Union City $2,100 -4.50% 0.50% $2,510 1.60% 7.70%
19 Petaluma $2,070 -5.00% 15.00% $2,440 2.50% 0.00%
20 San Ramon $2,050 -1.00% 5.70% $2,460 -3.50% 3.40%
21 Alameda $2,020 -3.30% 1.50% $2,560 -4.80% -10.80%
22 Oakland $1,960 1.60% -10.90% $2,550 -1.20% -1.90%
23 Hayward $1,870 -2.10% 3.90% $2,300 0.00% 5.50%
24 Livermore $1,810 2.30% 7.70% $2,190 -4.80% 3.30%
25 Richmond $1,710 2.40% -4.50% $2,240 5.20% 0.00%
26 San Leandro $1,700 -4.00% 3.00% $2,330 3.10% 15.30%
27 Concorde $1,620 -3.60% 2.50% $1,870 -3.10% 5.10%
28 Santa Rosa $1,550 2.00% 4.00% $2,000 4.70% 2.00%
29 Napa $1,490 -5.10% 2.10% $2,210 1.80% 6.80%
30 Vallejo $1,300 0.00% 8.30% $1,600 0.00% 10.30%
À propos
Le rapport Zumper Dallas Metro a analysé les annonces actives de Appartements à Dallas qui sont arrivés sur le marché en septembre 2017. Les annonces sont regroupées par ville pour calculer les loyers médians demandés.
Vous cherchez un nouveau logement ? Consultez toutes les annonces. Appartements à louer à Dallas Disponible dès maintenant sur Zumper.
Restez informé des actualités de Zumper en nous suivant sur Facebook, Gazouillement, Instagram, & Pinterest.
Contenu associé


