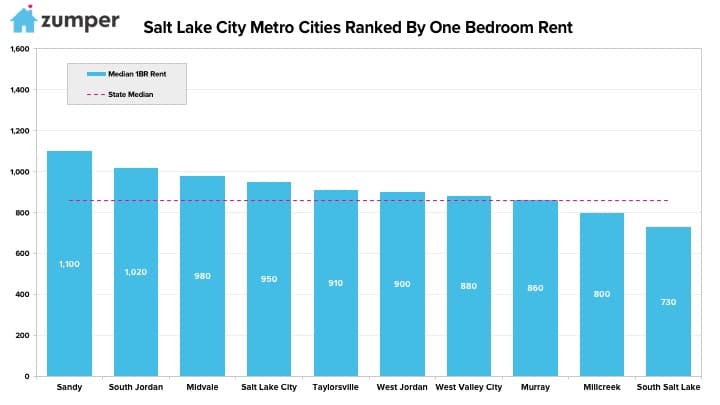
The Zumper Salt Lake City Metro Report analyzed active listings in January across 10 metro cities to show the most and least expensive cities and cities with the fastest growing rents. The Utah state median rent was $857 last month.
Cities Ranked By Rent
Le plus cher
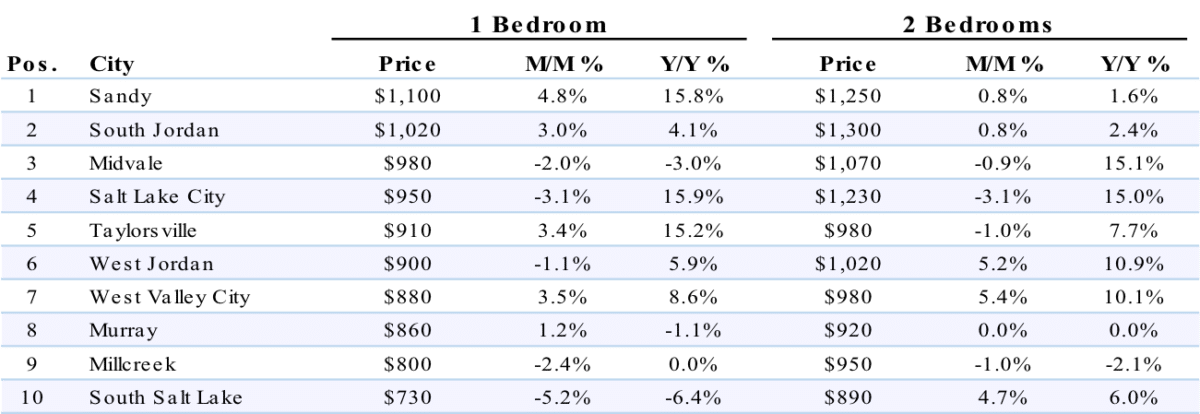
–Sandy, UT rent grew $50 to $1,100 and continued to rank as the most expensive in the metro.
–South Jordan, UT moved up one spot, and past Midvale, to become the second priciest city with rent at $1,020.
–Midvale, UT fell to third with one bedrooms priced at $980.
Le moins cher
– South Salt Lake, UT rent dropped $40 to $730 and remained the most affordable in the metro.
–Millcreek, UT ranked as second with rent at $800.
–Murray, UT dropped one spot to become the third least expensive city with rent at $860.
Growth Rate
La croissance la plus rapide (Y/Y%)
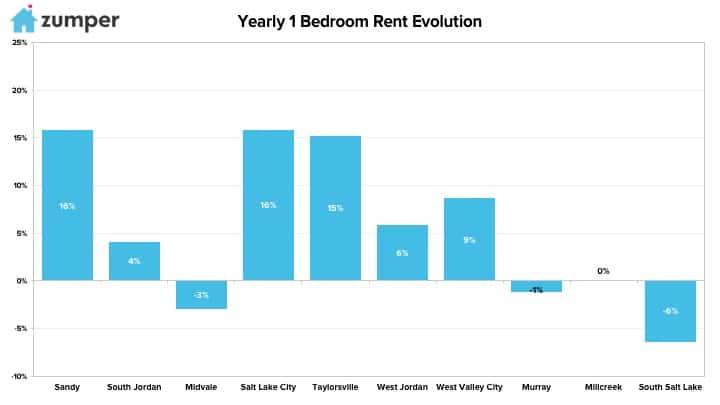
–Salt Lake City, UT had the fastest growing rent since this time last year, climbing 15.9%.
–Sandy, UT followed closely behind as second with rent growing 15.8%.
–Taylorsville, UT had the third largest year over year rental growth rate, up 15.2%.
La croissance la plus rapide (M/M%)
–Sandy, UT also had a large monthly rental growth rate, increasing 4.8%.
Full Data
| Quartier | March 18 One Bed Rent | Y/Y% Change |
|---|---|---|
| Lower Pacific Heights | $3,630 | 10.00% |
| Bayview | $2,750 | 7.84% |
| Tenderloin | $2,550 | 6.25% |
| Lower Haight | $3,450 | 6.15% |
| Presidio Heights/Laurel Heights | $3,300 | 5.77% |
| Outer Sunset | $2,570 | 4.90% |
| Marina | $3,350 | 4.69% |
| Lakeshore | $2,890 | 3.21% |
| Alamo Square | $3,400 | 3.03% |
| Lake Street | $3,000 | 1.69% |
| Outer Mission/Excelsior | $2,150 | 2.87% |
| Pacific Heights | $3,850 | 2.67% |
| Western Addition | $3,200 | 1.59% |
| Mission | $3,450 | 1.47% |
| Buena Vista/Ashbury Heights | $3,500 | 1.45% |
| Hayes Valley | $3,550 | 1.43% |
| Bernal Heights | $3,000 | 0.33% |
| West of Twin Peaks | $2,950 | 0.00% |
| Nob Hill | $2,990 | -0.33% |
| Downtown | $3,125 | -0.79% |
| Cow Hollow | $3,150 | -1.25% |
| South Beach | $3,700 | -1.33% |
| Lone Mountain | $2,650 | -1.85% |
| Castro | $3,500 | -1.96% |
| Outer Richmond | $2,500 | -1.96% |
| Financial District | $3,495 | -2.92% |
| Noe Valley | $3,200 | -3.03% |
| Mission Bay/Dogpatch | $3,500 | -3.31% |
| Inner Sunset | $2,625 | -3.67% |
| SOMA | $3,500 | -4.11% |
| Parkside | $2,150 | -4.44% |
| Russian Hill | $3,450 | -5.48% |
| Potrero Hill | $3,300 | -5.71% |
| Civic Center | $3,100 | -6.06% |
| Haight Ashbury | $2,990 | -6.56% |
| NOPA | $3,040 | -7.60% |
| North Beach | $3,125 | -8.09% |
| Glen Park | $2,800 | -8.20% |
| Telegraph Hill | $3,200 | -8.57% |
| Corona Heights | $3,200 | -8.57% |
| Mission Dolores | $3,350 | -8.97% |
| Inner Richmond | $2,550 | -10.53% |
| Cole Valley | $2,950 | -14.49% |
À propos
The Zumper Dallas Metro Report analyzed active listings of Salt Lake City apartments that hit the market in January 2018. Listings are aggregated by city to calculate median asking rents.
In the market for a new place? Search all Salt Lake City apartments on Zumper now.
Stay up to date with Zumper by following us on Facebook, Gazouillement, Instagram, & Pinterest.
Contenu associé


