The Zumper Phoenix Metro Report analyzed active listings in September across 12 metro cities to show the most and least expensive cities and cities with the fastest growing rents. The Arizona one bedroom median was $885 last month.
Cities Ranked By Rent
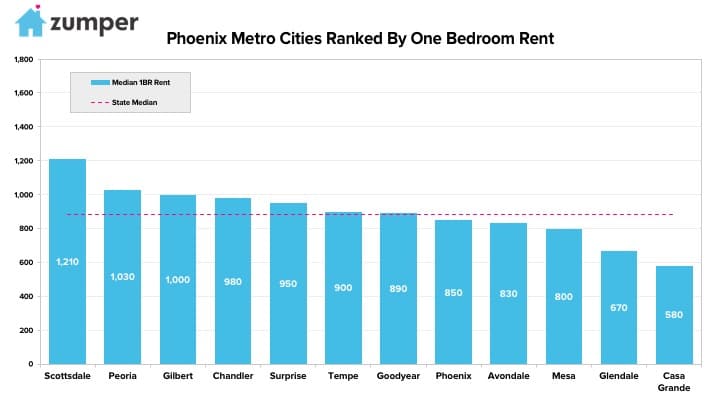
The Most Expensive
–Scottsdale, AZ held onto its position as the most expensive city with rent up $10 last month to $1,210.
–Peoria, AZ jumped one spot, outpacing Gilbert, to become the second most expensive city with rent at $1,030.
– Gilbert, AZ rent dropped $50 to $1,000 and became the third priciest in the metro.
The Least Expensive
–Casa Grande, AZ rent, though growing $30 last month to $580, was the least expensive in the metro.
–Glendale, AZ followed behind as the second most affordable city with rent at $670.
–Mesa, AZ was third with one bedrooms priced at $800.
Growth Rate
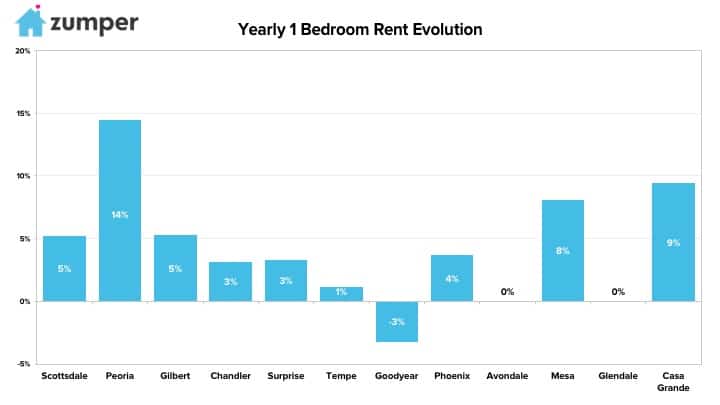
The Fastest Growing (Y/Y%)
–Peoria, AZ had the fastest growing rent since this time last year, up 14.4%.
–Casa Grande, AZ rent was the second fastest growing, climbing 9.4%.
–Mesa, AZ was third with prices jumping 8.1%.
The Fastest Growing (M/M%)
–Casa Grande, AZ also had a large monthly growth rate, up 5.5%.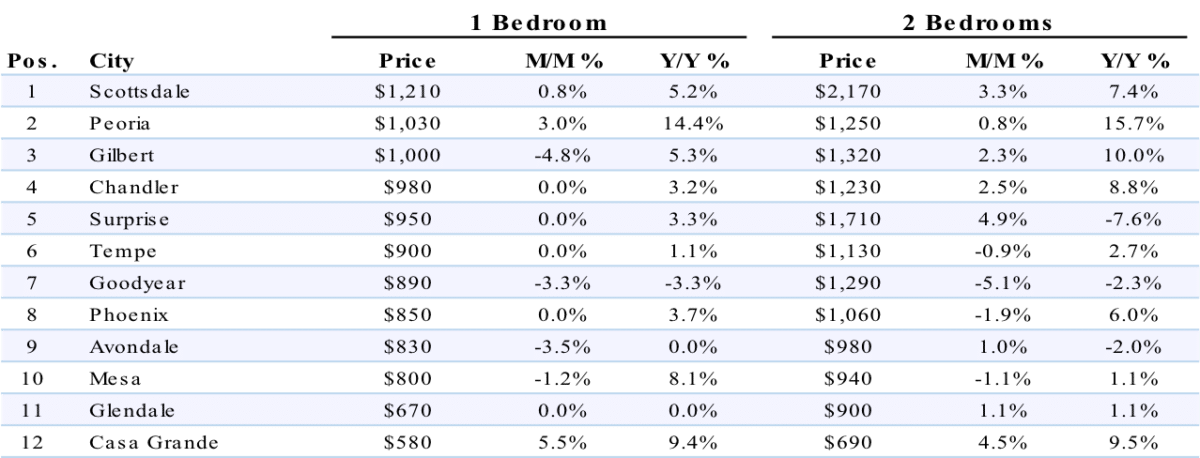
Full Data
1 Bedroom 2 Bedrooms
Pos. City Price M/M % Y/Y % Price M/M % Y/Y %
1 San Francisco, Californie $3,390 -0.90% 1.80% $4,380 -2.70% -2.70%
2 New York, NY $2,900 1.00% -3.30% $3,360 5.00% -1.20%
3 San Jose, CA $2,400 1.70% 9.10% $2,870 5.10% 8.70%
4 Washington, D.C. $2,330 1.70% 11.50% $3,060 -2.50% 14.20%
5 Boston, Massachusetts $2,250 2.30% 0.40% $2,690 3.10% 4.30%
6 Los Angeles, Californie $2,200 4.80% 8.40% $3,180 1.30% 6.40%
7 Oakland, CA $2,060 5.10% -6.40% $2,500 -2.00% -7.10%
8 Seattle, WA $1,840 2.20% 0.50% $2,410 -1.20% -3.20%
9 Miami, Floride $1,750 0.00% -2.80% $2,400 -1.20% -4.00%
10 Honolulu, HI $1,700 -1.70% 0.00% $2,110 -0.50% -11.00%
11 San Diego, CA $1,690 2.40% 8.30% $2,210 -1.80% 2.30%
12 Chicago, Illinois $1,530 0.00% -15.90% $2,180 0.00% -11.40%
13 Fort Lauderdale, FL $1,500 -1.30% 0.00% $1,900 -2.60% -5.00%
14 Long Beach, CA $1,430 5.10% 5.10% $1,900 1.60% 5.60%
15 Denver, Colorado $1,410 1.40% 15.60% $1,810 3.40% 13.10%
15 Philadelphie, Pennsylvanie $1,410 0.70% 0.70% $1,600 0.00% 6.00%
17 New Orleans, LA $1,380 5.30% -4.20% $1,460 -1.40% -13.10%
18 Atlanta, Géorgie $1,370 -0.70% 3.00% $1,750 4.20% 4.80%
19 Providence, RI $1,360 -4.90% -1.40% $1,530 -5.00% 6.30%
20 Portland, Oregon $1,330 -1.50% -1.50% $1,540 -1.30% -3.80%
21 Dallas, Texas $1,320 -1.50% 6.50% $1,740 -3.30% 4.20%
21 Scottsdale, AZ $1,320 4.80% 12.80% $2,100 -2.30% -1.90%
23 Houston, Texas $1,260 5.00% 15.60% $1,560 4.00% 14.70%
24 Nashville, TN $1,230 4.20% 9.80% $1,300 0.00% 1.60%
25 Madison, WI $1,210 0.00% -1.60% $1,300 0.00% -9.10%
25 Minneapolis, MN $1,210 0.00% -12.30% $1,720 -4.40% -5.50%
27 Baltimore, MD $1,180 0.90% 15.70% $1,400 2.90% 9.40%
28 Charlotte, Caroline du Nord $1,170 5.40% 5.40% $1,250 1.60% 4.20%
28 Pittsburgh, PA $1,170 -4.90% -7.90% $1,330 0.00% -5.00%
30 Austin, Texas $1,150 4.50% -3.40% $1,420 2.90% -5.30%
30 Orlando, Floride $1,150 -1.70% 15.00% $1,300 0.80% 8.30%
30 Plano, TX $1,150 2.70% 6.50% $1,490 0.00% 0.70%
30 Sacramento, CA $1,150 0.00% 15.00% $1,350 0.00% 15.40%
34 Irving, TX $1,120 0.00% 9.80% $1,420 5.20% 10.90%
35 Gilbert, AZ $1,100 4.80% 13.40% $1,360 0.00% 11.50%
35 Tampa, Floride $1,100 3.80% 15.80% $1,310 4.80% 13.90%
37 Aurora, CO $1,050 5.00% 7.10% $1,320 -2.20% 4.80%
37 Chandler, AZ $1,050 5.00% 14.10% $1,210 -0.80% 8.00%
39 Richmond, VA $1,040 5.10% 13.00% $1,130 1.80% 13.00%
40 Virginia Beach, VA $1,030 0.00% 10.80% $1,200 0.80% 4.30%
41 Newark, NJ $1,000 0.00% 6.40% $1,200 0.00% 4.30%
42 Fort Worth, TX $990 5.30% 10.00% $1,230 2.50% 12.80%
42 Henderson, NV $990 5.30% 4.20% $1,100 -0.90% 0.00%
44 Raleigh, NC $980 1.00% 4.30% $1,100 1.90% 0.00%
45 Durham, NC $960 -3.00% 4.30% $1,100 0.00% 0.90%
46 Anchorage, AK $940 4.40% 2.20% $1,150 4.50% 0.00%
46 Jacksonville, FL $940 4.40% 9.30% $1,050 1.00% 1.90%
46 St Petersburg, FL $940 4.40% 10.60% $1,330 4.70% -3.60%
49 Louisville, KY $930 3.30% 14.80% $980 2.10% 10.10%
49 Salt Lake City, UT $930 4.50% 10.70% $1,240 -0.80% 15.90%
49 Syracuse, NY $930 2.20% 14.80% $980 3.20% 3.20%
52 Corpus Christi, TX $900 4.70% 5.90% $1,000 0.00% 1.00%
53 Phoenix, Arizona $890 4.70% 6.00% $1,080 -0.90% 5.90%
54 Buffalo, NY $880 -5.40% -7.40% $1,070 -5.30% -9.30%
55 Fresno, CA $870 4.80% 2.40% $1,000 1.00% 5.30%
55 Kansas City, MO $870 4.80% 8.70% $1,000 0.00% 5.30%
57 Chesapeake, VA $860 0.00% -11.30% $1,180 0.00% 7.30%
58 Baton Rouge, LA $850 3.70% 1.20% $890 1.10% -9.20%
58 San Antonio, TX $850 2.40% -2.30% $1,060 3.90% -4.50%
60 Colorado Springs, CO $840 5.00% 2.40% $1,050 -4.50% 2.90%
60 Las Vegas, Nevada $840 5.00% 12.00% $1,000 2.00% 5.30%
60 Mesa, AZ $840 5.00% 10.50% $940 2.20% 2.20%
60 Milwaukee, WI $840 -2.30% 6.30% $890 -1.10% 1.10%
64 Boise, ID $830 0.00% 12.20% $930 0.00% 8.10%
65 Reno, NV $820 5.10% 15.50% $1,130 3.70% 15.30%
66 Omaha, NE $790 -1.30% 6.80% $930 -2.10% 3.30%
67 Des Moines, IA $750 5.60% -8.50% $800 -2.40% -4.80%
67 Lexington, KY $750 5.60% 2.70% $920 2.20% 3.40%
69 Chattanooga, TN $730 4.30% 4.30% $770 0.00% 1.30%
69 Rochester, NY $730 2.80% 2.80% $850 0.00% 0.00%
69 Spokane, WA $730 2.80% 14.10% $850 -1.20% 9.00%
72 Bakersfield, CA $720 4.30% 10.80% $850 -1.20% 6.30%
72 Laredo, TX $720 -5.30% -10.00% $900 2.30% -4.30%
74 Arlington, TX $710 2.90% 4.40% $940 1.10% 4.40%
74 Knoxville, TN $710 4.40% 4.40% $780 -1.30% -2.50%
76 Cleveland, OH $700 -1.40% 14.80% $750 0.00% 1.40%
76 Glendale, AZ $700 4.50% 1.40% $890 -5.30% 4.70%
78 Norfolk, VA $690 1.50% 1.50% $850 -4.50% 2.40%
78 St Louis, MO $690 4.50% -5.50% $970 5.40% -3.00%
80 Cincinnati, OH $680 0.00% 1.50% $970 0.00% 14.10%
80 Oklahoma City, OK $680 4.60% 7.90% $760 -3.80% -3.80%
80 Winston Salem, NC $680 1.50% -1.40% $730 0.00% -2.70%
83 Greensboro, NC $660 4.80% 0.00% $780 0.00% 6.80%
83 Tucson, AZ $660 4.80% 3.10% $800 0.00% 5.30%
85 Augusta, GA $650 4.80% -7.10% $730 -5.20% -9.90%
85 Columbus, Ohio $650 -4.40% 8.30% $960 -1.00% 4.30%
85 Memphis, TN $650 0.00% 8.30% $700 0.00% 7.70%
85 Tallahassee, FL $650 3.20% -3.00% $760 -2.60% 1.30%
89 Albuquerque, NM $630 -1.60% 0.00% $800 -2.40% -3.60%
89 El Paso, TX $630 5.00% -1.60% $750 1.40% -1.30%
89 Indianapolis, IN $630 5.00% 10.50% $700 -2.80% 4.50%
92 Tulsa, OK $620 5.10% 8.80% $730 1.40% -2.70%
93 Lincoln, NE $610 1.70% -15.30% $820 -4.70% -12.80%
94 Detroit, MI $580 5.50% 5.50% $650 0.00% 3.20%
94 Shreveport, LA $580 3.60% 3.60% $640 3.20% -9.90%
96 Lubbock, TX $550 0.00% -1.80% $700 0.00% 0.00%
96 Toledo, OH $550 1.90% 14.60% $630 3.30% 14.50%
98 Akron, OH $540 0.00% 5.90% $680 4.60% 13.30%
99 Wichita, KS $510 4.10% 0.00% $670 1.50% 3.10%
100 Fort Wayne, IN $490 4.30% 0.00% $550 0.00% -11.30%
About
The Zumper Phoenix Metro Report analyzed active listings that hit the market in September 2017. Listings are aggregated by city to calculate median asking rents.
In the market for a new place? Search all Phoenix apartments on rent on Zumper now.
Stay up to date with Zumper by following us on Facebook, Gazouillement, Instagram, & Pinterest.
Contenu associé