The Zumper Phoenix Metro Report analyzed active listings in December across 11 metro cities to show the most and least expensive cities and cities with the fastest growing rents. The Arizona one bedroom median was $964 last month.
Cities Ranked By Rent
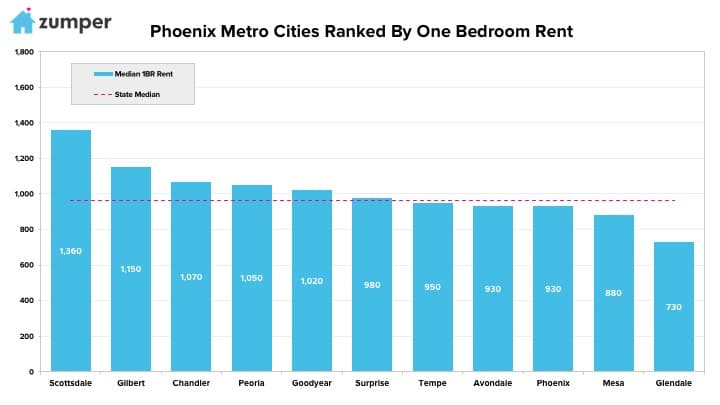
The Most Expensive
–Scottsdale, AZ rent grew $40 to $1,360 and continued to reign as the most expensive in the metro.
–Gilbert, AZ ranked as second with one bedrooms priced at $1,150.
–Chandler, AZ remained third with rent at $1,070.
The Least Expensive
–Glendale, AZ rent, though growing $30 to $730, continued to rank as the most affordable in the metro.
–Mesa, AZ was second with rent at $880.
–Phoenix & Avondale, AZ were tied for third again with prices at $930.
Growth Rate
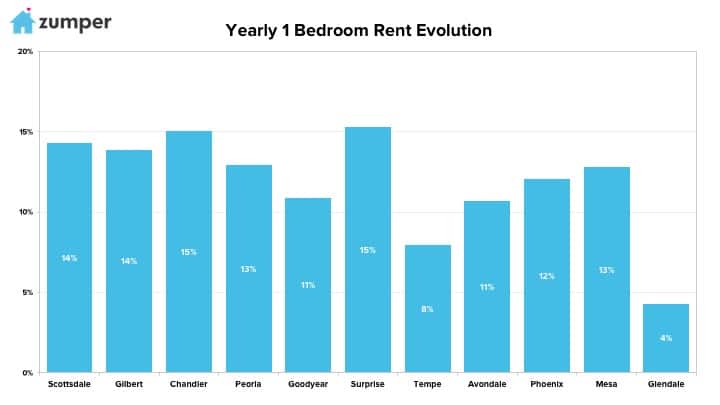
The Fastest Growing (Y/Y%)
–Surprise, AZ continued to have the largest year over year rental growth rate with one bedrooms up 15.2%.
–Chandler, AZ had the second fastest growing rent, climbing 15.1%.
–Scottsdale, AZ was third with rent jumping 14.3%.
The Fastest Growing (M/M%)
–Peoria, AZ had the fastest growing rent last month, up 5%.
–Mesa, AZ followed closely behind as second with rent climbing 4.8%.
–Gilbert, Avondale, & Phoenix, Arizona were all tied for third with rent moving up 4.5%.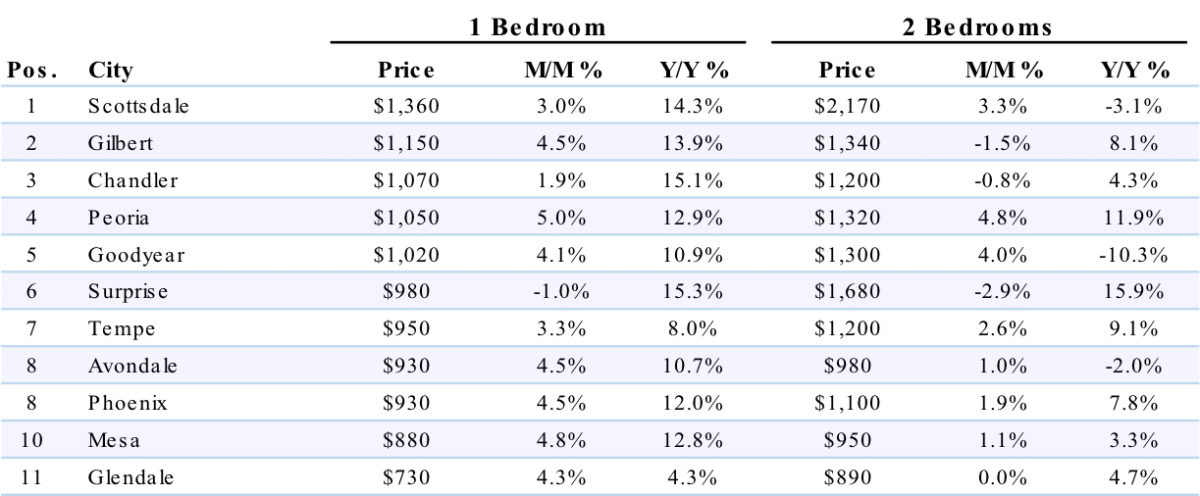
About
| 1 Bedroom | 2 Bedrooms | ||||||
|---|---|---|---|---|---|---|---|
| Pos. | City | Price | M/M % | Y/Y % | Price | M/M % | Y/Y % |
| 1 | San Francisco | $3,400 | 0.00% | 2.70% | $4,400 | 0.50% | -2.20% |
| 2 | Mountain View | $3,130 | -4.30% | 15.90% | $3,750 | 2.20% | 15.40% |
| 3 | Emeryville | $2,930 | 1.40% | 14.50% | $3,700 | 5.10% | 11.10% |
| 4 | Palo Alto | $2,870 | 1.40% | -5.60% | $3,530 | 0.90% | -4.60% |
| 5 | Redwood City | $2,710 | -1.50% | 3.40% | $3,510 | -4.90% | -8.80% |
| 6 | Santa Clara | $2,660 | 4.30% | 15.70% | $3,200 | 1.90% | 13.50% |
| 7 | Sunnyvale | $2,610 | -5.10% | 0.80% | $3,230 | 3.50% | 6.60% |
| 8 | Milpitas | $2,590 | 4.90% | 9.30% | $2,800 | 1.80% | 2.90% |
| 9 | San Mateo | $2,500 | -3.10% | 1.20% | $3,540 | 5.00% | 9.90% |
| 10 | San Jose | $2,460 | 0.00% | 9.80% | $2,780 | -2.50% | 3.70% |
| 10 | South San Francisco | $2,460 | 5.10% | 2.50% | $3,350 | 5.00% | 2.40% |
| 12 | Berkeley | $2,400 | 0.00% | 3.00% | $3,000 | -1.60% | -6.80% |
| 12 | Burlingame | $2,400 | 0.80% | -2.80% | $3,330 | 1.80% | -0.90% |
| 14 | Walnut Creek | $2,360 | 2.20% | 14.60% | $2,770 | 1.10% | 10.80% |
| 15 | Fremont | $2,310 | 5.00% | 10.50% | $2,500 | -1.20% | 3.30% |
| 16 | Daly City | $2,290 | -5.00% | 1.30% | $3,050 | -0.70% | 0.30% |
| 17 | Union City | $2,250 | 5.10% | 1.80% | $2,460 | -3.90% | -9.20% |
| 18 | Pleasanton | $2,180 | 0.50% | -1.80% | $2,550 | -4.90% | -4.50% |
| 19 | Petaluma | $2,170 | 4.80% | 6.40% | $2,420 | 0.80% | 0.80% |
| 20 | Alameda | $2,110 | -0.90% | 8.20% | $2,640 | -2.20% | -3.30% |
| 21 | Oakland | $2,100 | -2.80% | -0.50% | $2,470 | -5.00% | -5.00% |
| 22 | Livermore | $2,080 | 4.50% | 15.60% | $2,450 | 2.50% | 15.00% |
| 23 | San Ramon | $2,020 | 1.00% | 3.60% | $2,500 | 1.60% | 3.30% |
| 24 | Richmond | $1,980 | 4.80% | 1.50% | $2,360 | 3.10% | 10.30% |
| 25 | Hayward | $1,910 | -2.60% | 4.40% | $2,230 | -1.80% | 1.40% |
| 26 | Concord | $1,730 | 4.80% | 13.10% | $1,930 | 2.70% | 6.00% |
| 27 | Napa | $1,720 | 4.90% | 11.00% | $2,210 | -3.90% | -0.90% |
| 28 | San Leandro | $1,700 | -4.00% | -6.60% | $2,280 | 0.90% | 7.50% |
| 29 | Santa Rosa | $1,550 | -1.30% | 6.20% | $2,070 | -1.40% | 7.80% |
| 30 | Vallejo | $1,500 | 4.90% | 9.50% | $1,640 | 5.10% | 10.80% |
The Zumper Phoenix Metro Report analyzed active listings that hit the market in December 2017. Listings are aggregated by city to calculate median asking rents.
In the market for a new place? Search all Phoenix apartments on rent on Zumper now.
Stay up to date with Zumper by following us on Facebook, Gazouillement, Instagram, & Pinterest.
Contenu associé