The Zumper Phoenix Metro Report analyzed active listings in July across 13 metro cities to show the most and least expensive cities and cities with the fastest growing rents.
Cities Ranked By Rent
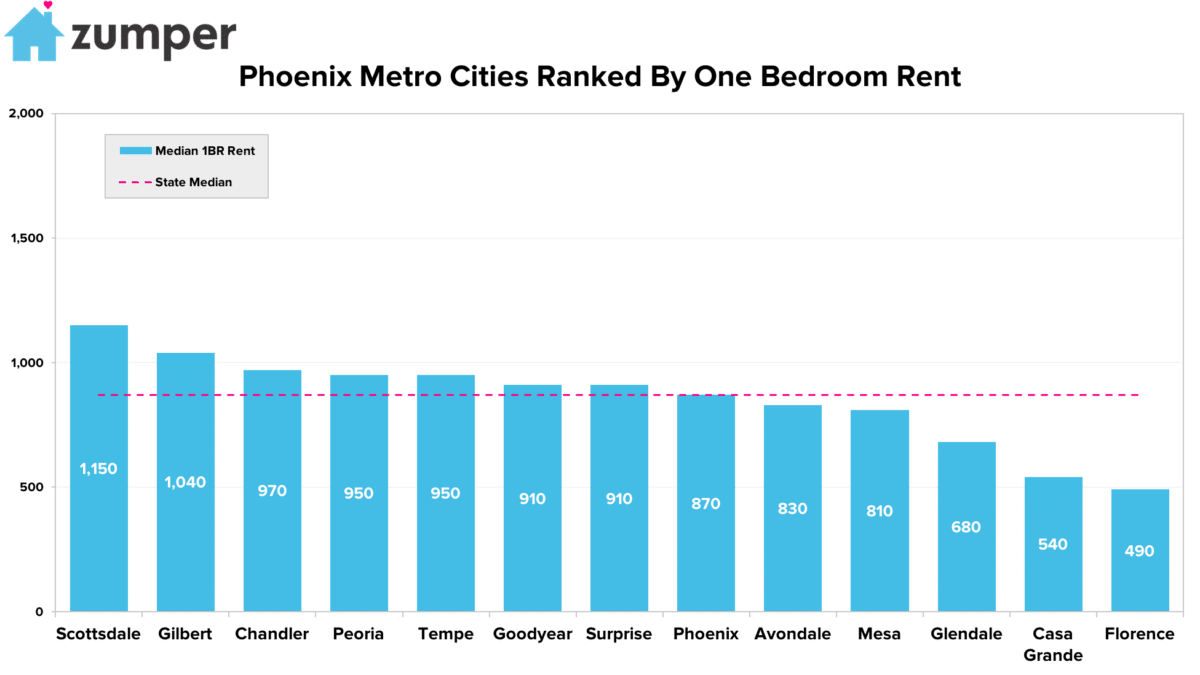
The Most Expensive
– Scottsdale, AZ rent, although dropping $50 to $1,150 since last month, remained the most expensive in the metro area.
– Gilbert, AZ was second with one bedroom units priced at $1,040.
–Chandler, AZ outpaced Peoria this month to rank as the third most expensive city with rent at $970.
The Least Expensive
–Florence, AZ‘s rent remained stable this month at $490 and continued to be the most affordable.
–Casa Grande, AZ rent grew $30 since last month but stayed the second least expensive.
–Glendale, AZ ranked as third with rent at $680.
Growth Rate
The Fastest Growing (Y/Y%)
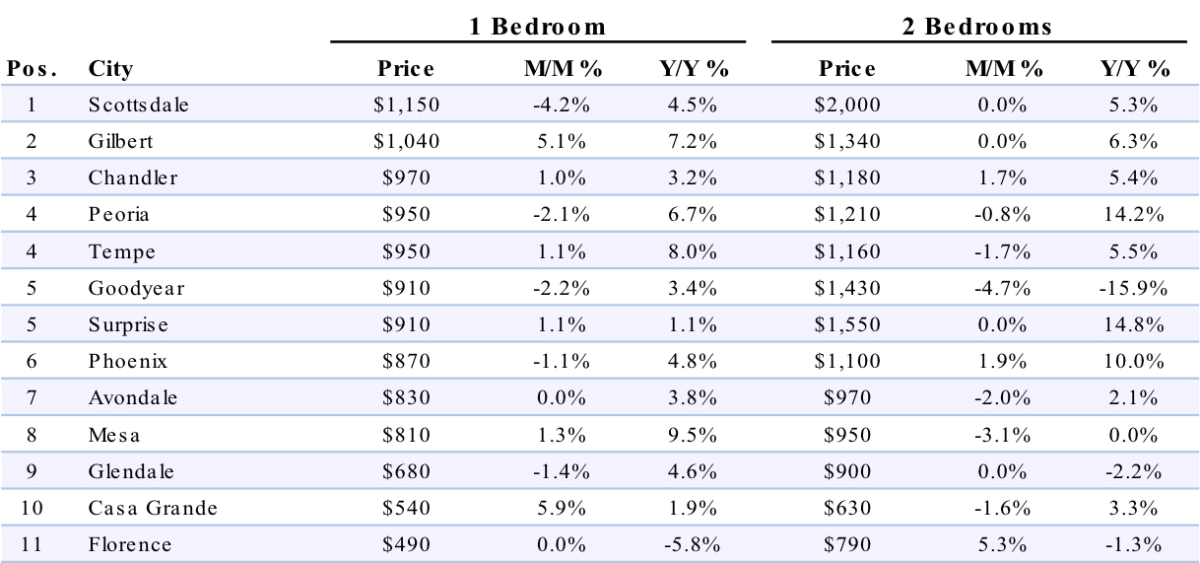
–Mesa, AZ had the fastest growing rent since this time last year, up 9.5%.
–Tempe, AZ rent was the second fastest growing, climbing 8% since last year.
– Gilbert, AZ was third with rent up 7.2%.
The Fastest Growing (M/M%)
–Casa Grande, AZ had the largest monthly growth rate, climbing 5.9%.
– Gilbert, AZ was second with rent up 5.1% since last month.
Full Data
| Pos. | City | Price | M/M % | Y/Y % | Price | M/M % | Y/Y % |
|---|---|---|---|---|---|---|---|
| 1 | Coronado | $3,640 | -5.00% | 15.60% | $4,350 | 1.90% | 10.10% |
| 2 | Solana Beach | $2,190 | -4.80% | -7.60% | $3,720 | 5.10% | -4.60% |
| 3 | Carlsbad | $1,780 | 4.70% | 12.70% | $2,330 | -0.90% | 15.30% |
| 4 | Encinitas | $1,750 | -2.80% | 4.20% | $2,630 | -4.00% | 1.50% |
| 5 | San Diego | $1,650 | 3.10% | 7.10% | $2,290 | 0.90% | 8.00% |
| 6 | Poway | $1,620 | 5.20% | 0.00% | $1,810 | 2.30% | 5.20% |
| 7 | Oceanside | $1,530 | 2.00% | 5.50% | $1,850 | 2.80% | 7.60% |
| 7 | San Marcos | $1,530 | -1.30% | 10.10% | $1,980 | 4.80% | 6.50% |
| 8 | Chula Vista | $1,470 | 5.00% | 9.70% | $1,800 | -3.20% | 5.90% |
| 9 | Vista | $1,450 | 0.70% | 2.10% | $1,700 | 0.00% | 3.00% |
| 10 | La Mesa | $1,430 | 0.00% | 10.00% | $1,810 | -0.50% | 11.70% |
| 11 | Escondido | $1,290 | -2.30% | 15.20% | $1,700 | 0.00% | 8.30% |
| 11 | Imperial Beach | $1,290 | 3.20% | 4.00% | $1,740 | 4.80% | 6.70% |
| 12 | El Cajon | $1,280 | 4.90% | 10.30% | $1,480 | 2.10% | 9.60% |
| 13 | National City | $1,210 | 0.80% | -6.90% | $1,520 | -5.00% | -7.30% |
| 14 | Lemon Grove | $1,200 | 0.00% | 0.00% | $1,500 | 0.00% | -2.60% |
About
The Zumper Phoenix Metro Report analyzed active listings that hit the market in July 2017. Listings are aggregated by city to calculate median asking rents.
In the market for a new place? Search all Phoenix apartments on rent on Zumper now.
Stay up to date with Zumper by following us on Facebook, Gazouillement, Instagram, & Pinterest
Contenu associé